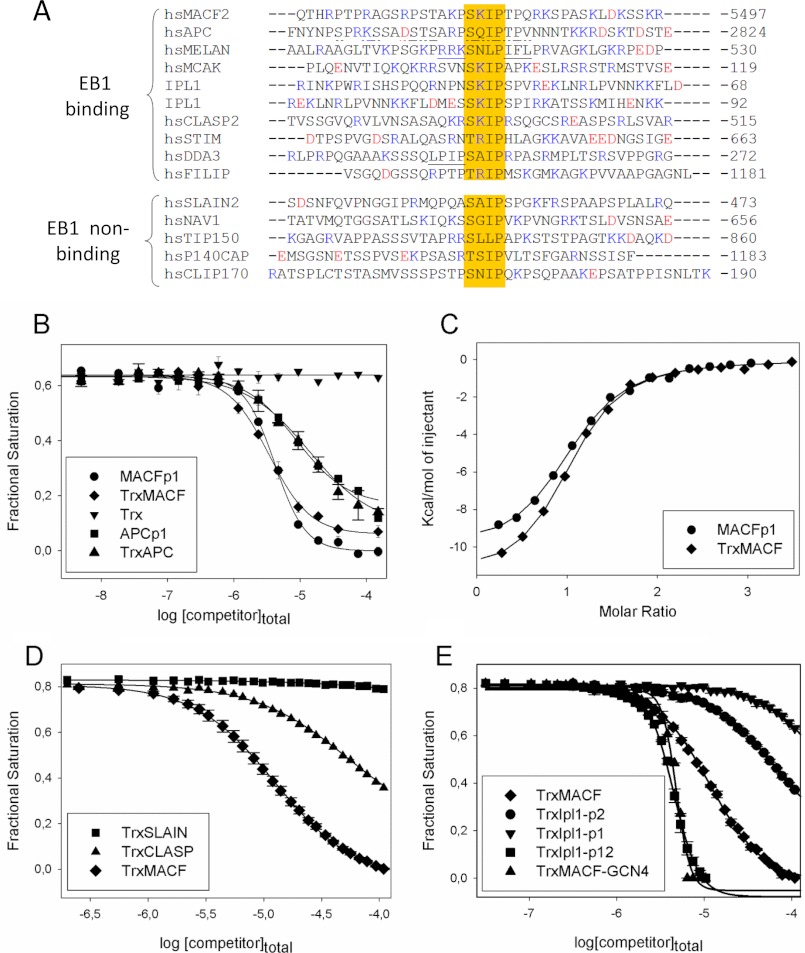
FIGURE 6.
EB1 binding affinities of different MtLS-containing +TIPs peptides. A, sequence alignment of +TIP fragments encompassing an MtLS: MACF2, accession number NP_899236 (6); APC, accession number P25054 (49); melanophilin, accession number AAH01653 (50); MCAK, accession number NP_006836 (51); Ipl1, accession number P38991 (24, 25); CLASP2, accession number NP_055912 (19); STIM1, accession number Q13586 (20); DDA3, accession number AAN73431 (52); FILIP, accession number NP_056502 (Jiang et al.)4; SLAIN2, accession number NP_065897 (21); Navigator, accession number NP_065176 (53); TIP150 (Tip-interacting protein of 150 kDa), accession number Q5JR59 (54); p140Cap, accession number P30622 (23); and CLIP170, accession number P30622 (55). The sequences are grouped into EB binders (Kd in the range between 1 and 140 μm) and non-binders (Kd in the millimolar range or higher). The residues proposed to compensate for the unfavorable residue at the X position of the SXIP motif in melanophilin, and DDA3 are underlined. APC residues encompassing the SXIP motif that were shown to interact with EB1c by NMR (15) are underlined with a discontinuous line (see “Results” for more details). B, displacement isotherms obtained by FP at 30 °C. Shown is the displacement of EB1-bound FC-MACFp1 by increasing amounts of MACFp1 (circles), APCp1 (squares), TrxMACF (diamonds), TrxAPC (triangles), and Trx alone (inverted triangles). C, binding isotherms obtained by ITC at 25 °C. MACFp1 (circles) or TrxMACF (diamonds) were titrated into a solution containing EB1. Data points (symbols) were fitted (solid line) by using the “one set of sites” binding model, following Equation 7, as described under “Experimental Procedures.” D, displacement isotherms obtained by FP at 25 °C. Shown is the displacement of EB1-bound FC-MACFp1 by increasing amounts of TrxMACF (diamonds), TrxCLASP (triangles), and TrxSLAIN (squares). E, displacement isotherms obtained by FP at 25 °C. Shown is the displacement of EB1-bound FC-MACFp1 by increasing amounts of unlabeled TrxMACF (diamonds), TrxIpl1-p1 (inverted triangles), TrxIpl1-p2 (circles), TrxMACF-GCN4 (triangles), and tandem TrxIpl1-p12 (squares). When shown, error bars represent S.E. values. FP-derived fractional saturation values (symbols) were calculated from the FP data, according to Equation 1, and fitted (solid line) to Equation 4, as described under “Experimental Procedures.”

