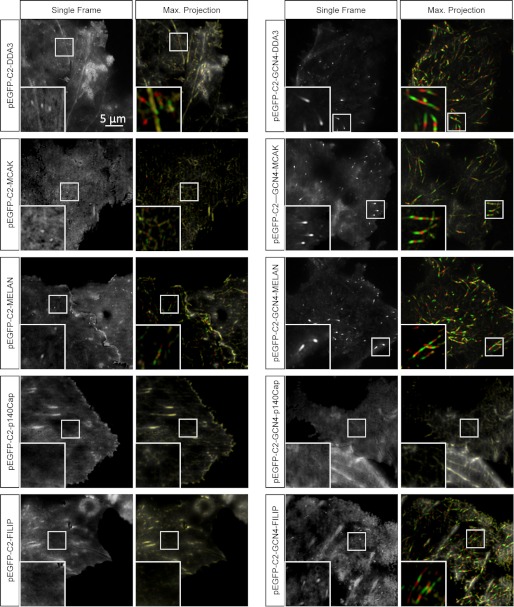
FIGURE 7.
Live cell imaging of monomeric and dimeric MtLS-containing peptides fused to GFP. Live images of COS-7 cells transiently transfected with the indicated GFP fusions are shown in two different ways. Panels on the left show single frames obtained by averaging of five consecutive images acquired with a 0.5-s interval (2.5 s in total). Panels on the right show maximum intensity projections of six consecutive and averaged frames, displayed in different colors. The first of the six frames is shown as grayscale (microtubule plus-ends are white), frames 2, 4, and 6 are shown in green (plus-ends appear green), and frames 3 and 5 are shown in red (plus-ends appear red). This representation facilitates the visualization of microtubule tip tracking events over time. Insets, enlargements of small parts of the images to illustrate the presence or absence of comet “tracks” reflecting +TIP accumulation at growing microtubule ends.

