FIGURE 2.
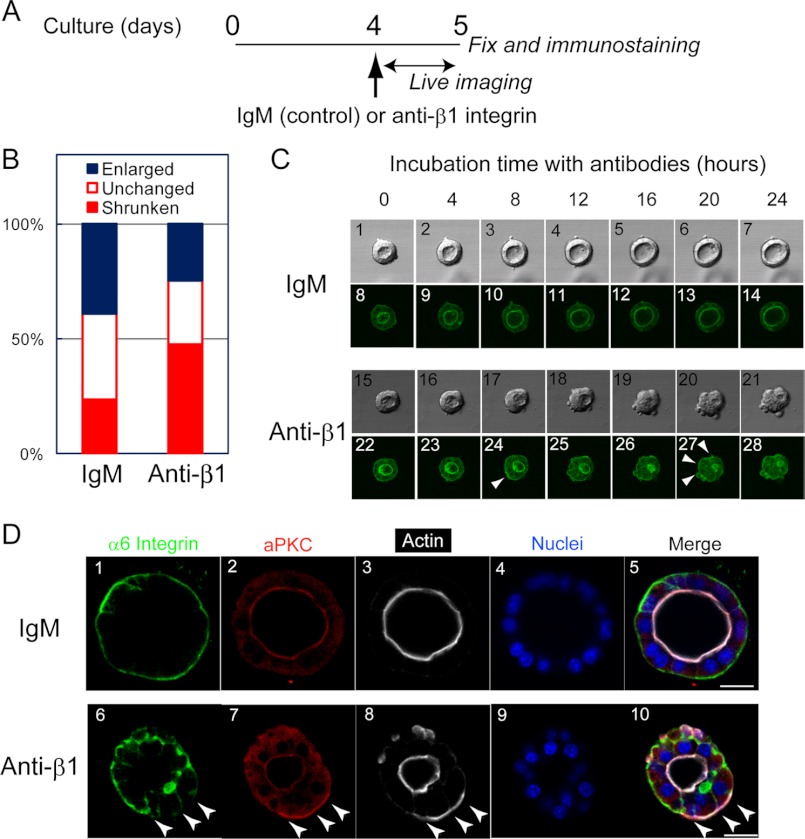
Live cell imaging shows the processes of loss of normal polarity and collapse of the central lumen in the presence of anti-β1 integrin antibody. A, timetable for live cell imaging and immunofluorescence. HPPL expressing YFP-actin was cultured in Matrigel for 4 days. After changing the upper layer to 5% Matrigel containing an anti-β1 integrin antibody, the plate was placed on a microscope, and images were acquired every 40 min in the following 24 h. B, the apical lumens of the cysts were categorized into three groups: enlarged, unchanged, and shrunken. The ratio of “shrunken” lumen was significantly increased in the presence of the anti-β1 integrin antibody as compared with the control. C, images taken every 4 h during live imaging are shown. Typically, HPPL exhibited a slightly expanded central lumen in the presence of control IgM (panels 1–14), whereas they lost apical localization of YFP-actin and the central lumen in the presence of the anti-β1 integrin antibody (panels 15–28). D, localization of apical and basal markers was examined at 24 h after the addition of the antibodies. When the central lumen still remained, apical markers such as aPKC and F-actin were evident at the basal domain (D, panels 7 and 8, arrowheads). In contrast, α6 integrin was excluded from the basal domain of the cells showing basal aPKC and F-actin (D, panel 6). Scale bars represent 20 μm.

