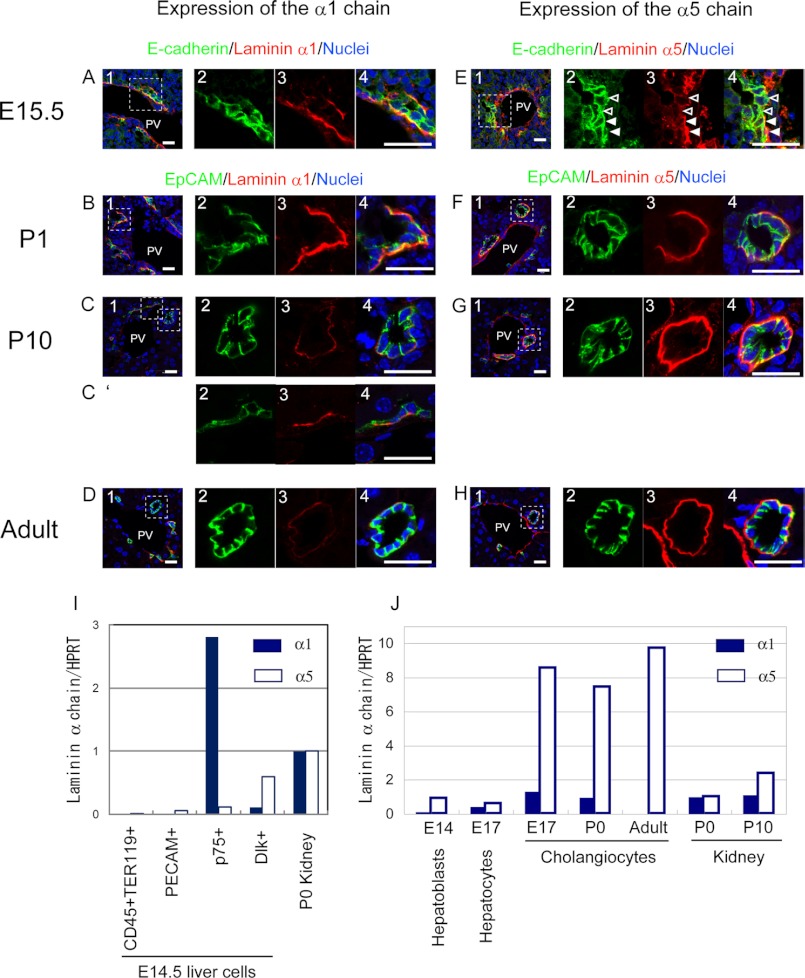
FIGURE 4.
Distribution of laminins α1 and α5 in developing liver. A–D, laminin α1 is detected at the basal side of E-cadherin+ cholangiocytes forming a ductal plate in E15.5 (A, panels 1–4) and EpCAM+ cholangiocytes in the P1 liver (B, panels 1–4), whereas its expression is dramatically reduced in the P10 liver (C, panels 1–4) and then disappears from the basal side of cholangiocytes forming mature bile ducts in the adult liver (D, panels 1–4). In the P10 liver, α1 is still observed at the basal side of the remaining ductal plate (C′, panels 2–4). Bars represent 20 μm. E–H, laminin α5 is detected at the basal side of most of the E-cadherin+ cholangiocytes in E15.5 (E, panels 1–4), although it is excluded from the basal side of some cholangiocytes (open arrowheads). In the P1 liver, laminin α5 is clearer at the basal side of cholangiocytes (F, panels 1–4). Later, laminin α5 is abundantly present at the basal side of cholangiocytes in P10 (G, panels 1–4) and adult liver (H, panels 1–4). Bars represent 20 μm. I, expression of laminins α1 and α5 by various types of cells at E14.5. Hematopoietic (CD45+TER119+) and endothelial (PECAM+) cells, progenitors of stellate and periportal fibroblasts (p75NTR+), and hepatoblasts (Dlk+) were isolated from the E14.5 fetal liver when hepatoblasts near the portal vein were undergoing differentiation to cholangiocytes. p75NTR+ cells express the α1 chain, whereas Dlk+ cells weakly express the α5 chain. The levels of α1 and α5 chains are presented in this graph as the ratio against the expression level of each α chain in the P0 kidney. J, expression of laminins α1 and α5 during differentiation along the cholangiocyte lineage. Laminin α1 increased 5-fold in E17 cholangiocytes as compared with E14 hepatoblasts. However, the expression of laminin α1 mRNA was transient; it decreased in P1 cholangiocytes and then disappeared in adult cholangiocytes. On the other hand, laminin α5 increased 9-fold in E17 cholangiocytes as compared with E14 hepatoblasts, and the strong expression of laminin α5 was maintained in neonatal and adult cholangiocytes. The expression of α1 and α5 chains in Dlk+ hepatoblasts, ICAM1+ hepatocytes, and EpCAM+ cholangiocytes isolated from the developing liver was examined by quantitative PCR. The levels of α1 and α5 chains are presented in the graph as the ratio against the expression level of each α chain in the P0 kidney. HPRT, hypoxanthine phosphoribosyltransferase; PV, portal vein.

