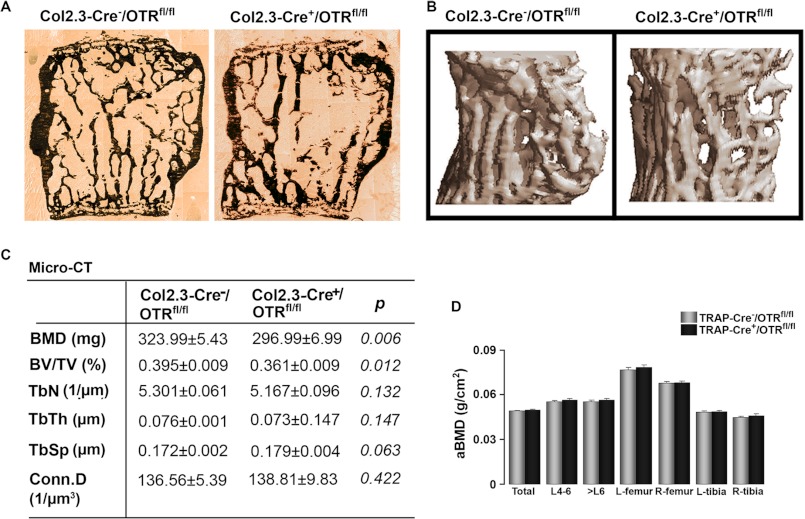
FIGURE 5.
Osteoblast-specific deletion of OTRs recapitulates global OTR deficiency. The skeletons of 16-week-old osteoblast-specific Col2.3-Cre+/OTRfl/fl mice or control Col2.3-Cre−/OTRfl/fl littermates were phenotyped for differences in static and dynamic histomorphometry parameters. Representative images show von Kossa-stained trabecular bone (A) and micro-computed tomography of trabecular bone (B). C, micro-computed tomography (Micro-CT)-derived estimates of volumetric BMD, BV/TV, Tb.N, trabecular thickness (TbTh), trabecular spacing (TbSp), and connectivity density (Conn.D) in the two genotypes (units as shown). D, areal BMD (aBMD) using PIXImus of the osteoclast-specific TRAP-Cre+/OTRfl/fl mice or control TRAP-Cre−/OTRfl/fl littermates recorded at the stated sites. Statistics were as follows: Student's t test with the Bonferroni correction, comparing Col2.3-Cre+/OTRfl/fl versus Col2.3-Cre−/OTRfl/fl mice (C) (p values as shown) and TRAP-Cre+/OTRfl/fl versus TRAP-Cre−/OTRfl/fl mice (D). L, left; R, right.

