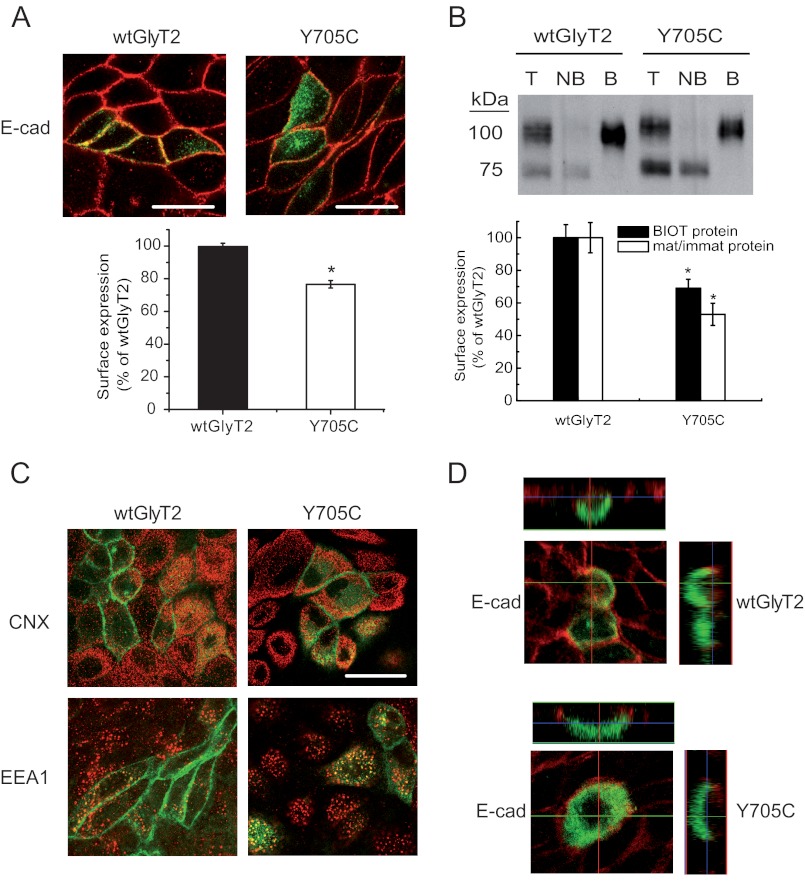
FIGURE 4.
Cell and plasma membrane expression of wild-type GlyT2 and Y705C. A, immunofluorescence quantification of plasma membrane transporters. Wild-type EGFP-tagged GlyT2 or Y705C expressed in MDCK cells for 48 h were immunolabeled for the plasma membrane marker E-cadherin (E-cad). Two channel confocal images were obtained (green for GlyT2 and red for E-cadherin), and regions occupied by E-cadherin were taken as plasma membrane and regions inside the cadherin staining were taken as intracellular, using the Image J ROI manager. After applying an automatic threshold to adjust images, the fluorescence intensity was measured separately for membrane and intracellular regions, and the percentage of transporter in plasma membrane was calculated (histogram). This process was performed at least in 150 cells/condition. *, p < 0.05 values calculated using Student's t test by comparing wild-type GlyT2 with the Y705C mutant. B, COS7 cells expressing wild-type GlyT2 or Y705C mutant were subjected to biotinylation as described under “Experimental Procedures.” 8 μg of total (lanes T) and nonbiotinylated proteins (lanes NB) and 24 μg of biotinylated proteins (lanes B) were subjected to Western blotting for GlyT2 detection, and the membranes were reprobed for calnexin immunoreactivity as a loading control. Lower panel, densitometric analysis. Black bars, total transporter that was biotin-labeled (B as a % of T) as percentage of that of wild-type GlyT2. Open bars, mature/immature transporter ratio (100 kDa/75 kDa) as a percentage of the ratio (100 kDa/75 kDa) for wild-type GlyT2. *, p < 0.05 in Student's t test. C, MDCK cells expressing wild-type EGFP-tagged GlyT2 or Y705C were immunolabeled for calnexin (CNX, endoplasmic reticulum marker) or early endosome antigen 1 (EEA1, early endosome marker). No significantly difference in co-localization was observed. D, MDCK cells transfected with wild-type EGFP-tagged GlyT2 or Y705C were plated on cell culture filter inserts and grown to confluence. Samples were examined by laser scanning confocal microscopy. Left panel, en face views. Right panel, x-z cross-sections. The x-z cross-sections are derived from the indicated transept lines.

