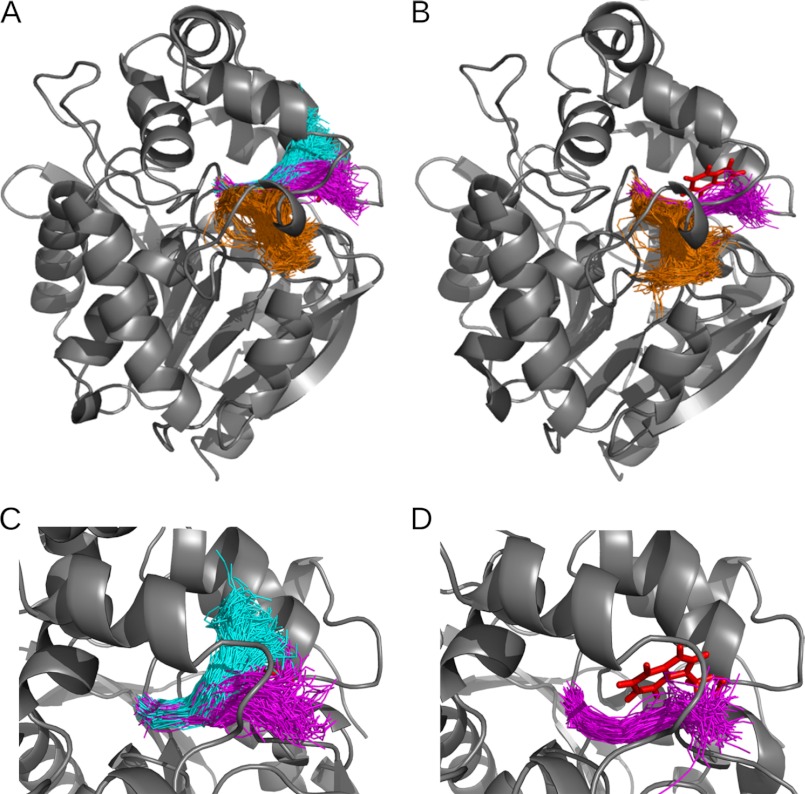
FIGURE 4.
Top ranked tunnel clusters identified in MD simulations of LinB WT and LinB L177W using CAVER 3.0. The tunnel cluster representing the p1b branch of the main tunnel is colored in magenta; p1a branch of the main tunnel is in cyan; and p2 tunnel is in orange. Tunnels identified in snapshots of the MD simulation are shown as tunnel center lines in one snapshot of protein conformation. Only a subset of the tunnel snapshots is shown for clarity. Other tunnel clusters (identified in less than 1% of MD snapshots) are omitted. Tunnel clusters are identified in LinB WT (A) and in LinB L177W (B). Close-up view is shown of the main tunnel (p1a and p1b) in LinB WT (C) and of the p1b branch of the main tunnel in LinB L177W (D). In LinB WT, the Leu-177 residue is hidden behind the center lines of the tunnels. In LinB L177W, the p1a branch of the main tunnel was not observed; the Trp-177 residue, which blocks the p1a tunnel, is shown in red stick representation. The figure was generated using the PyMOL visualization software.

