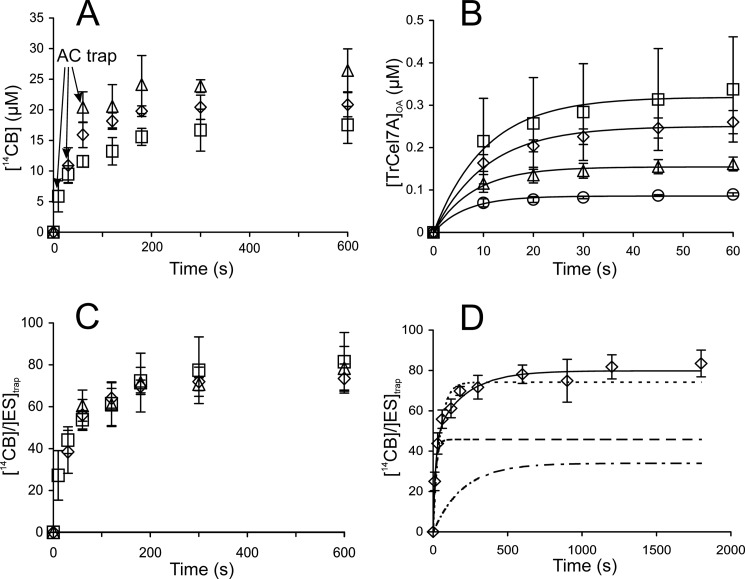
FIGURE 1.
Hydrolysis of 14C-BC by TrCel7A under single-turnover conditions. A, 14C-BC (0.5 mg ml−1) was incubated with 1.0 μm TrCel7A. An AC trap was added after 10 s (□), 30 s (♢), or 60 s (△) of hydrolysis, and the release of 14CB in time was followed. B, [TrCel7A]OA was measured from the inhibition of the hydrolysis of MUL by BC (0.5 mg ml−1). [TrCel7A] was 0.1 μm (○), 0.25 μm (△), 0.5 μm (♢), or 1.0 μm (□). Solid lines are from the non-linear regression according to Equation 2. C, data from A divided by the corresponding concentration of TrCel7A at the moment of the AC trap addition ([ES]trap). Values of [ES]trap were taken from B using an assumption that [ES]trap = [TrCel7A]OA. D, average [14CB]/[ES]trap ratios over experiments with different TrCel7A concentrations and different times of trap addition. Shown is non-linear regression according to the single exponent (Equation 3; dotted line) or to the sum of two exponents (Equation 4; solid line). The dashed line and the dashed and dotted line represent the fast and slow components of Equation 4, respectively. Error bars show S.D. and are from at least three independent measurements.

