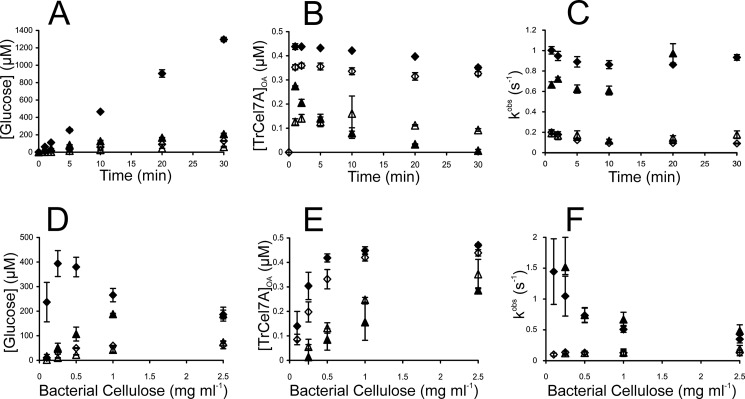
FIGURE 3.
Synergism in hydrolysis of BC by TrCel7A and EG TrCel5A. TrCel7A (♢), TrCel7A + EG (♦), CDTrCel7A (△), CDTrCel7A + EG (▴). Concentration of TrCel7A or CDTrCel7A was 0.5 μm, and that of β-glucosidase was 0.85 μm. If present, the concentration of EG was 0.1 μm. Error bars show S.D. and are from three independent measurements. In A–C, concentration of BC was 0.5 mg ml−1. A, glucose formation. B, concentration of TrCel7A with the active site occupied by the cellulose chain ([TrCel7A]OA) was measured from the inhibition of the hydrolysis of MUL by BC (0.5 mg ml−1). C, values of the observed rate constant (kobs) were found from the rates of cellobiose formation (recalculated from the rates of glucose formation) and values of [TrCel7A]OA according to Equation 6. D–F, data points were taken after 2, 5, and 10 min of hydrolysis. D, glucose formation after 10 min of hydrolysis. E, average values over all time points are plotted. Because of systematic variation in time, only 10 min data point values are plotted for the series with CDTrCel7A + EG. F, average kobs values over all time points are plotted. DSE values at different BC concentrations are listed in Table 2.

