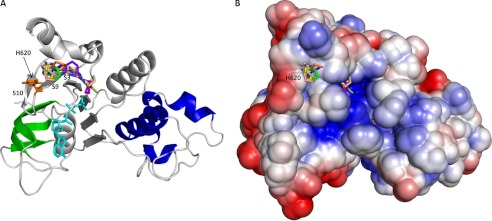
FIGURE 6.
Model of interaction of CFFT-001 with NBD1. Multiple binding modes for CFFT-001 interaction with F508del NBD1 ΔRIΔRE. A, ribbon diagram of WT NBD1 as in Fig. 1 with the compounds and ATP shown as stick models. Compounds in each binding mode are represented by different colors, whereas ATP and the side chain of His-620 are shown in cyan and orange, respectively. B, electrostatic surface representation of NBD1 (red, negative potential; blue, positive potential; white, hydrophobic) showing the same compounds as described in A.

