FIGURE 8.
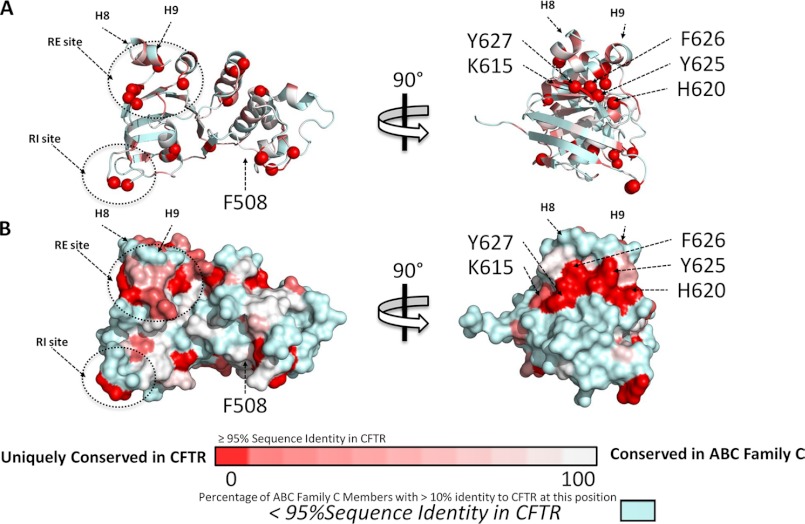
Sequence conservation unique to CFTR. Sequence profiles were determined for each of the 12 ABC subfamily C members, including CFTR. Conservation values were mapped onto the structure of WT CFTR NBD1 (Protein Data Bank 2PZE). Residues with <95% conservation in CFTR (by sequence identity) are colored in light blue. Residues with >95% conservation are colored in a gradient from red to white, with the residues that are unique to CFTR in red, and the residues that are present (>10% sequence identity) in other subfamily C members colored from dark pink (one matching ABC) to white (11 matching ABCs). A, ribbon diagrams in two orientations, with the N atoms of unique residues shown as spheres. B, solvent accessible surfaces for the same two orientations.

