FIGURE 5.
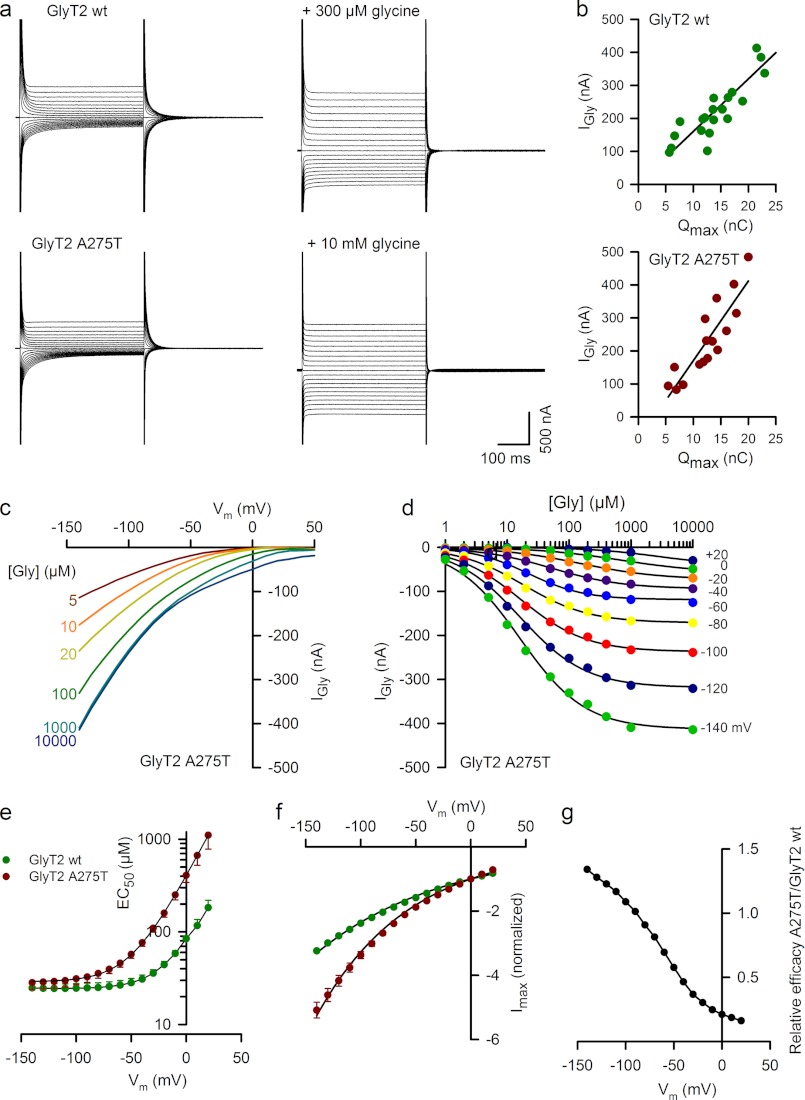
Current-voltage relationships and dose-response curves for the GlyT2 mutant A275T. a, current traces evoked by 500-ms voltage steps from +50 mV to −140 mV by decrements of 10 mV in representative oocytes expressing wild-type GlyT2 (upper panels) and the GlyT2 A275T mutant (lower panels) in control solution (left traces) or in the presence of glycine (right traces). b, plots of current amplitude evoked by glycine (1 mm) at −40 mV and Qmax (see “Experimental Procedures” and Fig. 6) relationship for oocytes expressing wild-type GlyT2 (upper panel) or GlyT2 A275T (lower panel). The solid lines show the linear regression with a slope of 15.9 s−1 (r2 = 0.773, n = 20) and 24.1 s−1 (r2 = 0.774, n = 14) for wild-type GlyT2 and A275T, respectively. c, voltage dependence of steady-state currents evoked by the glycine concentrations indicated at left in a representative oocyte expressing GlyT2 A275T. d, dose-response curves of the glycine-evoked current at the membrane potentials indicated on right in the same oocytes as in c. The solid lines are the least square fit of the data to the Hill equation: Igly = Imax/(1 + EC50/[gly])n. e, effect of membrane potential on glycine EC50 for oocytes expressing GlyT2 A275T (red circles, n = 8) and wild-type GlyT2 (green circles, n = 7). The solid lines correspond to the fit of the data to the equation EC50 = A + BαuVm, where A = 23.7 and 29 μm, B = 62.1 and 379 μm, and α = 1.4 and 1.34 for wild-type GlyT2 and A275T, respectively, where u = F/RT (R is the universal gas constant, T is the absolute temperature, and F is Faraday's constant). f, voltage dependence of Imax for wild-type GlyT2 (n = 8) and A275T (n = 7). Imax values were normalized by the values at 0 mV. The solid lines correspond to the fit of the data to the equation Imax = −e −βuVm, with β = 0.3 and 0.22 for wild-type GlyT2 and A275T, respectively. g, relative efficacy (Imax/EC50) of A275T/wild-type GlyT2.

