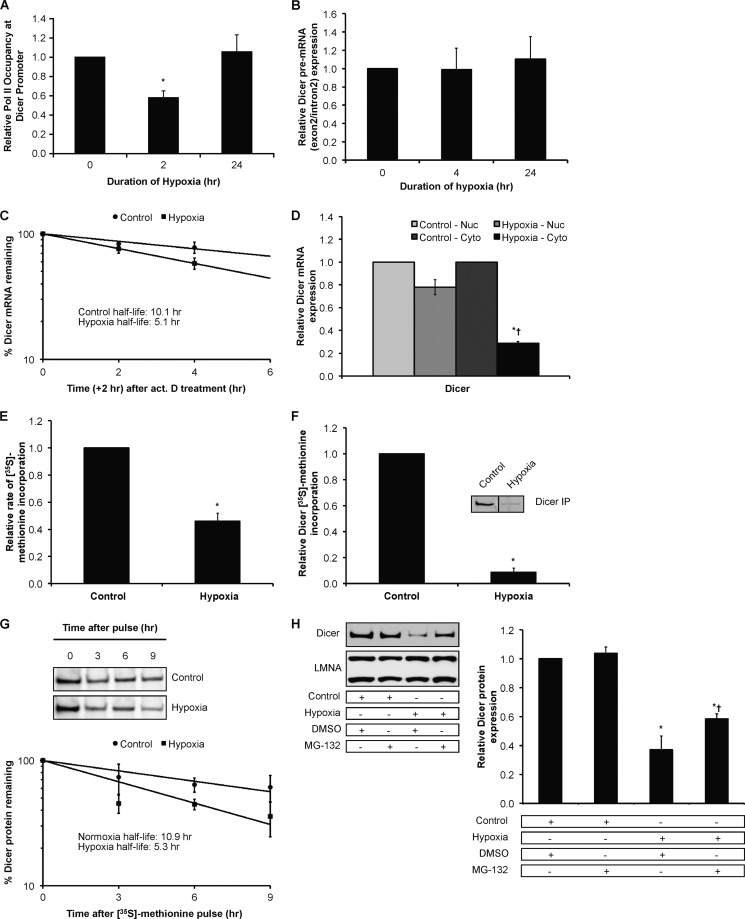
FIGURE 7.
Effect of chronic hypoxia on Dicer mRNA and protein. A, relative RNA polymerase II (Pol II) occupancy at the Dicer proximal promoter in hypoxic HUVEC. Data represent mean ± S.E. (error bars) (n = 3). * denotes p < 0.05 compared with 0 h. B, Dicer pre-mRNA measurements in hypoxic HUVEC. Data represent mean ± S.E. (error bars) (n = 4). C, Dicer mRNA half-life measurements in control versus hypoxic HUVEC. Data represent mean ± S.E. (error bars) (n = 3). D, Dicer mRNA levels in nuclear (Nuc) versus cytoplasmic (Cyto) fractions of control versus 24-h hypoxic HUVEC. Data represent mean ± S.E. (error bars) (n = 3). * and † denote statistical significance (p < 0.05) compared with hypoxia-nuclear and control-cytoplasmic, respectively. Relative rate of global protein synthesis (E) and relative Dicer protein synthesis (F) in normoxic versus 24-h hypoxic HUVEC measured using [35S]methionine incorporation. A representative gel is shown for F. Data represent mean ± S.E. (error bars) (n = 3). * denotes p < 0.05 compared with normoxia. G, Dicer protein half-life measurements in control versus hypoxic HUVEC. Data represent mean ± S.E. (error bars) (n = 3). A representative gel from each condition is shown. H, representative immunoblots of control versus 24-h hypoxic HUVEC treated with MG-132 (left panel). Quantification of Dicer immunoblots is shown in the right panel. Data represent mean ± S.E. (error bars) (n = 3). * and † denote statistical significance (p < 0.05) compared with control-DMSO and hypoxia-DMSO, respectively. IP, immunoprecipitation.

