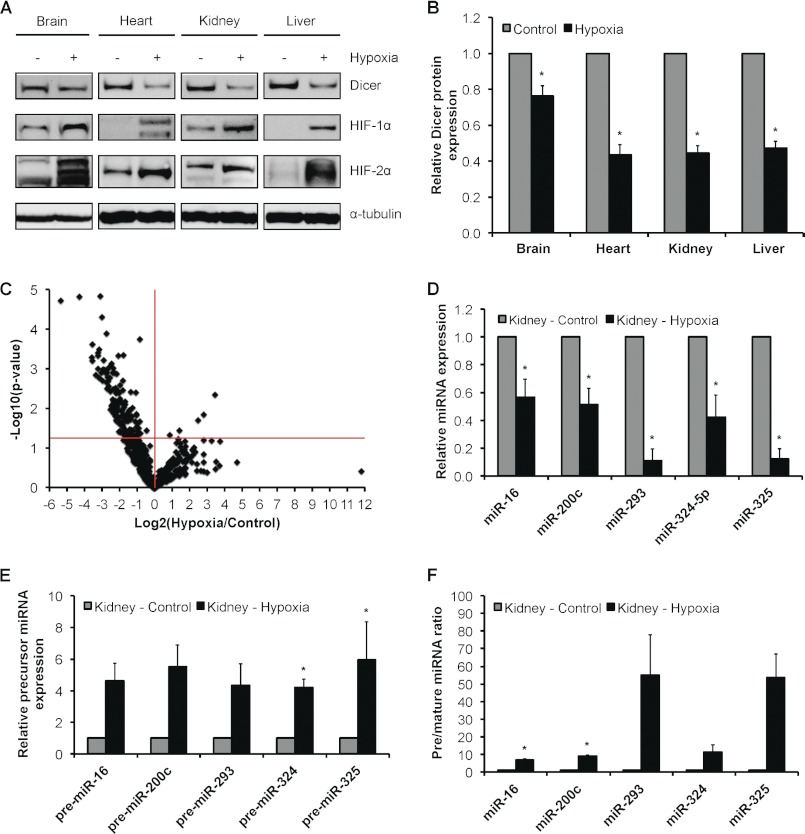
FIGURE 8.
Effect of chronic hypoxia on Dicer expression and function in mouse organs. A, representative immunoblots of control versus 24-h hypoxic mouse brain, heart, kidney, and liver. B, quantification of Dicer immunoblots in A. Data represent mean ± S.E. (error bars) (n = 5/6). * denotes p < 0.05 compared with normoxia. C, volcano plot of 582 detectable microRNAs in 24-h hypoxic versus control mouse kidney as measured by qRT-PCR profiling (n = 4). Expression levels of representative down-regulated microRNAs (D) and corresponding precursor microRNAs (E) and the ratio of precursor microRNAs to their mature counterparts (F) are shown. Data represent mean ± S.E. (error bars) (n = 4). * denotes statistical significance (p < 0.05) compared with kidney-control.

