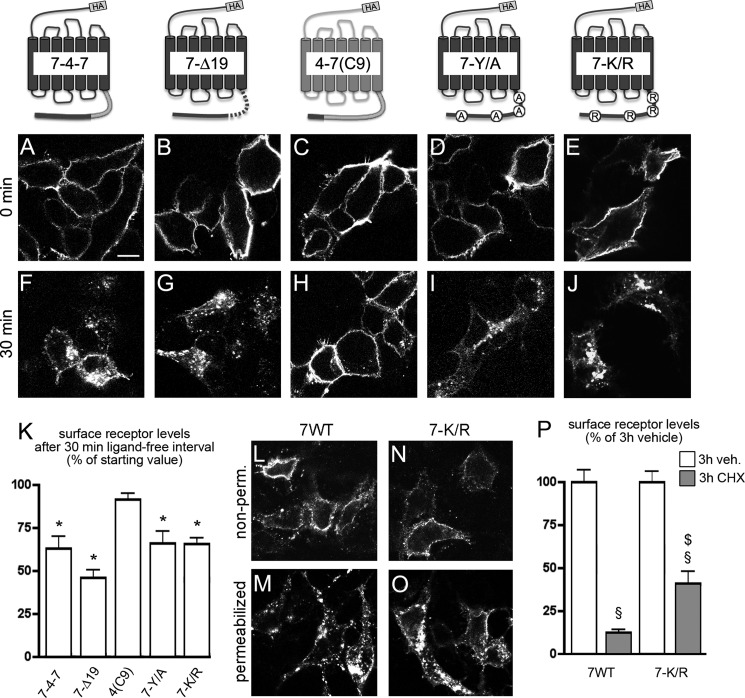
FIGURE 2.
Motifs in the CXCR7 C-terminal domain regulating ligand-independent receptor internalization. HEK293 cells were transiently transfected with constructs for HA-tagged receptors carrying mutations in putative internalization regulating C-terminal motifs. In CXCR7–4-7 and CXCR7-Δ19 residues 320–338 of CXCR7 (putative helix eight-containing region) were replaced by the corresponding CXCR4 sequence or deleted. In CXCR4–7(C9) the last nine residues of CXCR4 were replaced by those of CXCR7. In CXCR7-Y/A and CXCR7-K/R all C-terminal tyrosine and lysine residues were replaced by alanines and arginines, respectively. A–J, surface receptors were pulse labeled by anti-HA antibody applied to live cells at 4 °C. Confocal images show the subcellular localization of label receptors immediately after the anti-HA pulse (0 min, A–E) or after a 30-min ligand-free interval at 37 °C (F–J). A, B, F, and G, CXCR7 residues 320–338 are not involved in ligand-independent CXCR7 internalization. C and H, the last nine CXCR7 C-terminal residues containing a YSAL motif are not sufficient for ligand-independent CXCR4 internalization. D, E, I, and J, C-terminal tyrosine and lysine residues are not critical for plasma membrane targeting and ligand-independent internalization of CXCR7. K, quantitative analysis of receptor internalization by ELISA. For each receptor, the surface receptor level after the 30-min ligand-free interval is expressed as percentage of its surface receptor level after 0 min (nonpermeabilized cells). L-O, fixed permeabilized and nonpermeabilized (nonperm.) transfectants of CXCR7-WT and CXCR7-K/R were immunostained with anti-HA antibody. Both receptors are present at the plasma membrane. Permeabilization reveals preponderant intracellular localization of CXCR7-WT and CXCR7-K/R. P, analysis of CXCR7-WT and CXCR7-K/R surface receptor expression in nonpermeabilized cells subjected to 3-h vehicle (veh.) or 3-h CHX treatments using ELISA. Student's t test comparing signals after 30 versus 0 min (*), vehicle versus CHX (§), and CXCR7-WT versus CXCR7-K/R ($). Data represent mean ± S.E. calculated from 3 independent experiments with 4 repeats each. Scale bar = 10 μm in A–J and L–O.

