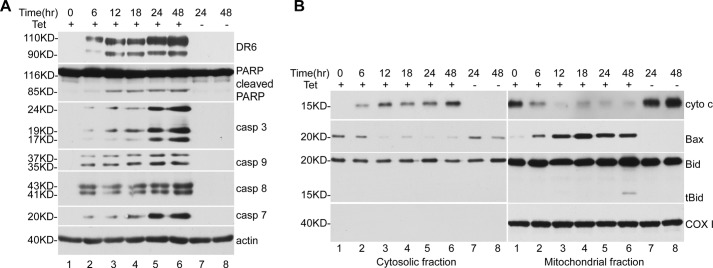
FIGURE 2.
Time course of DR6-induced apoptosis. After induction of DR6 expression by the addition of tetracycline (Tet), cells were harvested at various time points as indicated and divided into two portions. Half of the harvested cells were directly lysed and separated by SDS-PAGE, followed by Western blot analysis. The other half of the cells were used for preparation of cytosolic extracts and mitochondria-containing membrane fraction as described under “Experimental Procedures.” A, top panel shows induction of DR6 expression. Second panel shows PARP cleavage. Third, fourth, fifth, and sixth panels show activation of caspase-3, caspase-9, caspase-8, and caspase-7, respectively. The activation of caspases was determined by the formation of active forms of these caspases. This membrane was also reprobed with anti-actin antibody to indicate relative loading of samples (bottom panel). B, top panels show release of cytochrome c from mitochondria (right column) to the cytosol (left column). Second panels show translocation of Bax from cytosol (left panel) to mitochondria (right panel). Third panel show tBid formation and translocation to mitochondria. Fourth panel shows the reprobe of the second panels with anti-COX I antibody confirming the mitochondria remained intact during preparation.

