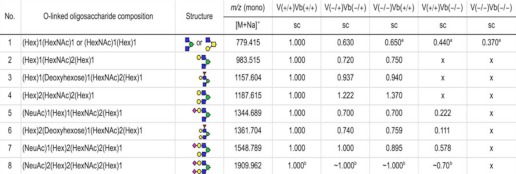
TABLE 1.
Specific O-linked oligosaccharides identified by MS/MS mass spectrometry in brain tissues of various genotypes
The relative amounts compared with wild type were calculated as follows: x, <0.05.
a Data are not unique.
b The signals were too low for accurate relative quantification. sc means charged. Red triangle indicates Fuc; green circle indicates Man; yellow circle indicates Gal; blue square indicates GlcNAc; yellow square indicates GalNAc, and red diamond indicates NeuAc.

