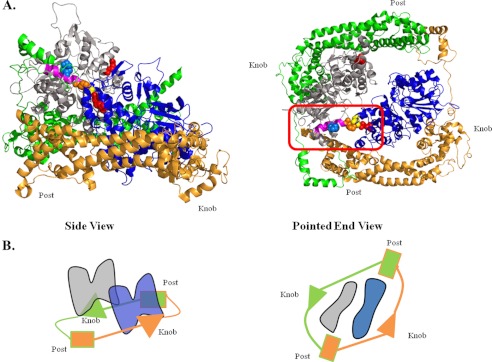
FIGURE 11.
Model of Bni interaction with the actin oligomer. A, model of the actin oligomer based on the filament model of Oda et al. (43) and the Bni1 FH1-FH2 fragment from Rosen et al. (49). The actin monomer colors are blue and gray. Residues are color highlighted: orange, Lys-113; marine blue, Lys-118; yellow, Glu-195; red, Arg-256; and pink, helix containing residues 113–125. The FH1-FH2 domain colors are gold and green. The red rectangle frames this unit of interaction. Models were generated using the PyMOL Molecular Graphics System (version 1.5; Schrödinger, LLC). The two models are a side view and a pointed end view of the structure. B, schematic drawing demonstrating the formin/actin complex colored as above. The post site of the green bridge is free and accessible to recruit an incoming actin subunit.

