
FIGURE 4.
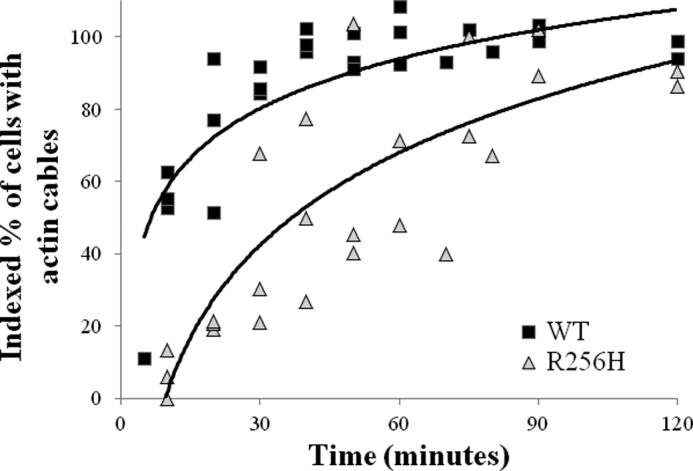
Impact of the R256H mutation on actin cytoskeleton assembly in vivo. A scatter plot of the indexed percentage of cells with actin cables relative to time after treatment with latrunculin A. Cells were transiently treated with latrunculin A to disassemble the cytoskeleton, washed, and incubated. Aliquots of cells were removed at designated time points, fixed, stained with rhodamine-phalloidin, and imaged as described under “Experimental Procedures.” The percentage of cells with actin cables was quantified for each sample and indexed to the pretreatment fraction. At least 50 cells were analyzed per sample, and the experiments were repeated three times. The scatter plot graph displays the indexed percentage of cells with actin cables relative to time for all analyses. Logarithmic trend lines depict the differences in rate of actin cable reassembly between wild type and R256H actin.