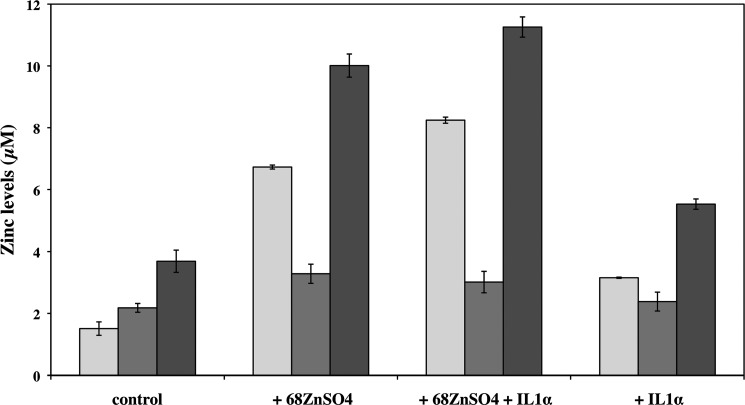
FIGURE 5.
Concentration of zinc (in μm) in MTs (light gray bars) and in species other than MTs (dark gray bars) in the cytosolic fraction of HCEsv cells. Cultured HCEsv cells were either not treated (control) or exposed to 68ZnSO4 and IL1α separately or in combination (i.e. 68ZnSO4+IL1α) for 24 h. The total concentration of zinc bound to all zinc binding species including MTs (black bars) is also shown. Quantitative analysis was performed by IPD-HPLC-ICP-MS.

