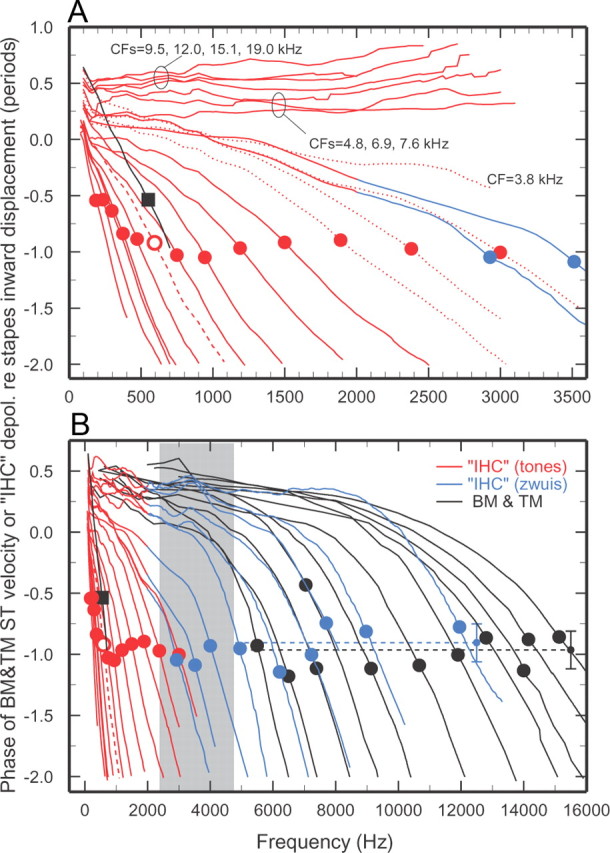
Figure 1.

Phase-frequency curves for IHC depolarization and BM and TM vibrations. A, Presents the data of B (CFs ≤3 kHz) using an expanded frequency scale. Phases are referred to inward displacement of the middle-ear ossicles [for IHCs, see Ruggero et al. (1990), their Fig. 11]. Red traces: IHC phase-frequency curves derived from averages of responses to tones of many ANFs with CFs (red circles) within nonoverlapping 1/3-octave bands [Temchin and Ruggero (2010), their Fig. 10]. Dotted red traces in A indicate data for CFs in the transition region (gray band), which have exceptionally large SDs for low stimulus frequencies. Blue traces: IHC phase-frequency curves derived from averages of responses to tone complexes (“zwuis” stimuli) (van der Heijden and Joris, 2003), anchored to the phases of responses to tones (van der Heijden and Joris, 2005; Cai et al., 2009). The blue traces for central CFs of 2.9, 3.5, 4, 4.9, 6.2, 7.2, 7.7, 9, and 12 kHz (blue circles) represent, respectively, 5, 6, 10, 7, 8, 7, 7, 4, and 5 ANFs. B, The overall mean phase (−0.91 period) is indicated by the blue dashed trace and small symbol, with ±SD (0.15 period) indicated by the vertical blue bracket. BM and TM curves (black traces) indicate peak velocity toward scala tympani. The BM curves (CFs, filled circles) represent all available measurements in chinchilla ears in which middle-ear vibrations were also recorded [Rhode and Recio (2000), their Figs. 5B, 6B; Recio and Rhode (2000), their Fig. 6A,B; Narayan and Ruggero (2000), their Fig. 2; Ruggero et al. (1997), their Fig. 15]; and unpublished data of A. Recio-Spinoso and W.S. Rhode. Most of the BM curves are averages of measurements at two or three sites. The overall BM mean phase (−0.97 period) is indicated by the black dashed trace and small symbol, with ±SD (0.21 period) indicated by the vertical black bracket. The TM curve (average CF = 600 Hz; filled square) represents measurements in six chinchillas [Rhode and Cooper (1996), their Fig. 5B]. Gray band: CF range where ANF tuning curves change their shape [Temchin et al. (2008), their Fig. 7B]. IHC phases inferred from responses to tones of 434 ANFs in 63 chinchillas and tones complexes (selected from a total of 65 ANFs in 17 chinchillas).
