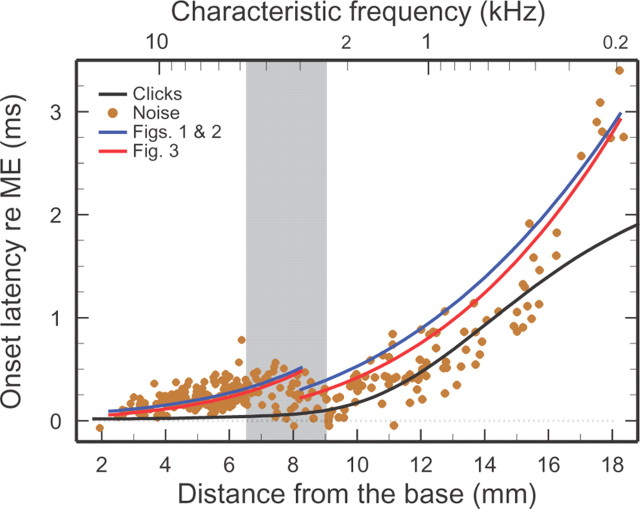
Figure 4.
Onset latencies of IHC impulse responses plotted against cochlear place. Onset latencies of IHC depolarization (filled color symbols) were estimated from the time-domain onsets of Wiener kernels for ANF responses to low-level white noise, which resemble impulse responses but are dominated by frequencies near CF. The black trace indicates the signal-front delay, i.e., the onset latency of BM responses to intense clicks [Temchin et al. (2005), their Fig. 13A]. The Wiener-kernel latencies are longer than signal-front delays because the latter include spectral components that travel at higher speeds than near-CF frequencies (“frequency dispersion”). Onset latencies of IHC depolarization were also estimated from the CF phases of Figures 1 and 2 (blue traces) and by spatial integration of the velocity curves of Figure 3 between 0 mm and the characteristic places (red traces). In the basal region, the latencies measured by the two procedures fully coincided. Therefore, for the sake of display clarity, the red trace was displaced downward by 25 μs. All latencies have been corrected for neural/synaptic (0.96 ms) and middle-ear delays. Gray band marks the region where ANF tuning curves change their shape, IHC responses change their polarity (Fig. 2), and traveling wave velocities attain a local maximum (Fig. 3). Wiener-kernel data recorded from 303 ANFs in 40 chinchillas.

