Figure 6.
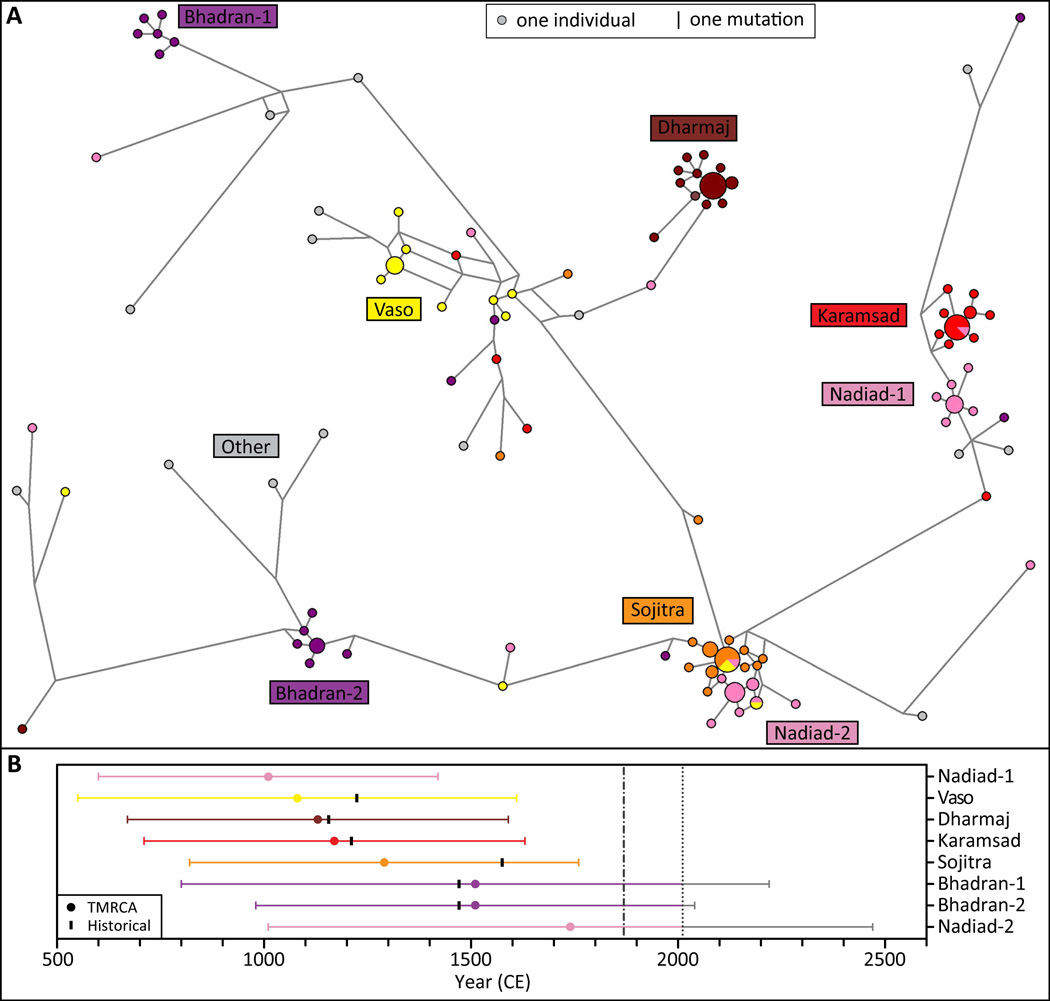
Relationships between Y-chromosomal haplotypes. (A) Median-joining network of 140 Y chromosomes from the six CGP villages and other Gujaratis. Twenty-four Y-chromosomal microsatellites were typed in 124 males from the six CGP villages and 16 Gujarati males from outside the gol. The relationships between the haplotypes were determined using the program NETWORK 4.516. Circles represent the microsatellite haplotypes and have areas proportional to the haplotype frequencies. Villages of origin are indicated by color; clusters of haplotypes from the same village are labeled. Line lengths represent the number of mutational differences between the haplotypes; the shortest line is one mutation. A line that abuts one or more haplotype circles may appear shorter than the number of mutations it represents, as part of the line may be covered by circles. (B) TMRCA estimates for each cluster in the Y-chromosome median-joining network. Clusters are ordered from top to bottom by increasing TMRCA estimates. Dots indicate TMRCA estimates, and colored lines represent their standard deviations. Black lines indicate the time of settlement of each village by Patels based on historical accounts, where available.

