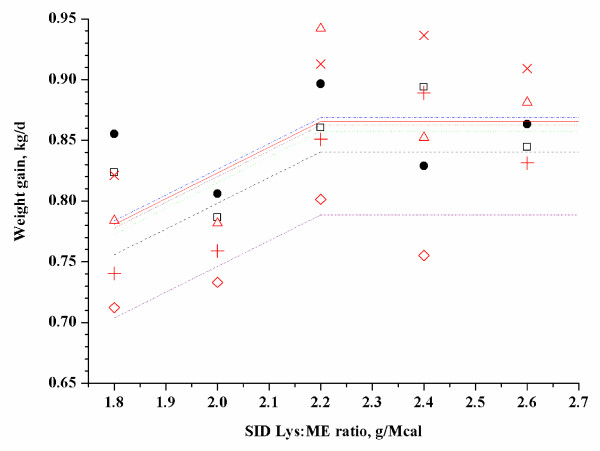
Figure 3.
Fitted straight broken-line of weight gain as a function of SID-Lys:ME ratio (Exp. 6). Observed block mean values in each treatment (dot represent block 1, square represent block 2, triangle represent block 3, × represent block 4, plus represent block 5, DIAMOND represent block 6) are shown. Two observations (× in treatment two and DIAMOND in treatment five) were considered outliers because they were influential points in the model. The straight broken line: y = 0.8587 - 0.209 × (2.2 - x) + LVAR (r2 = 0.74, adjusted r2 = 0.59). Parameter LVAR represents the block effect and produces different lines for the respective blocks. The optimum SID Lys:ME ratio was 2.2 in 84 to 109 kg pig.

