Figure 2 .
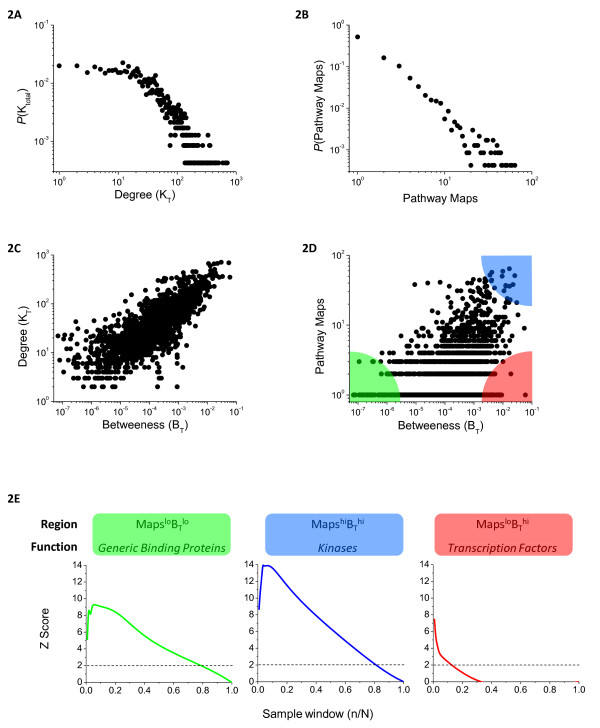
Distribution of structural and functional annotations in the Ensemble network. Distribution of node Degree(A) and Pathway Maps (number of pathways a given gene is annotated as being involved in) (B). These two metrics are plotted against Betweeness (C and D respectively) for all 2,361 genes comprising the network. The Pathway Maps vs. Betweeness distribution is separated into 3 regions; MapshiBThi, MapsloBThi, and MapsloBTlo, color-coded blue, red, and green respectively (D). Hypergeometric Z Scores quantify the enrichment of Kinases, Transcription factors, and Generic binding proteins across the 3 respective topological regions. Z-Scores are first computed for the top 10 genes comprising the tip of the region (n = 10), and the sample window (n/N) is then successively widened across the entire network, and scores iteratively computed to evaluate the distribution of protein function vs. topology. Z-Scores greater than 2 correspond to P-values less than 0.05 (E).

