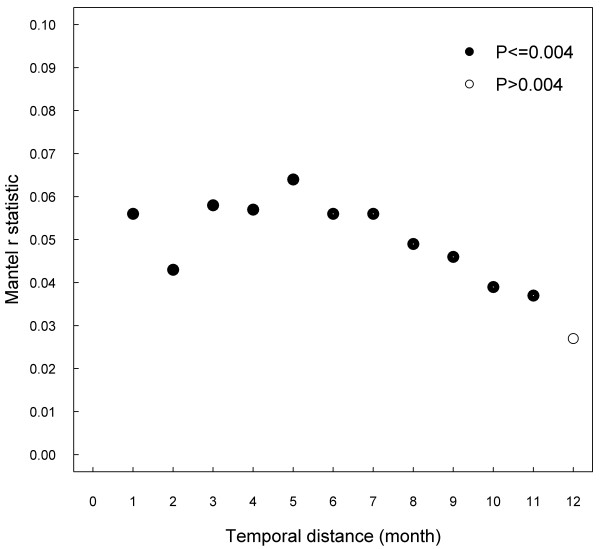
Figure 2.
Correlogram showing Mantel r statistic computed on binary matrices of genetic (≥98%, <98% homology) and temporal distances for different thresholds (month). Results from 7381 different pairwise combinations of 122 PRRSV ORF5 sequences. Dark dots indicate significant correlation (P ≤ 0.004) after 9999 permutations of matrices.

