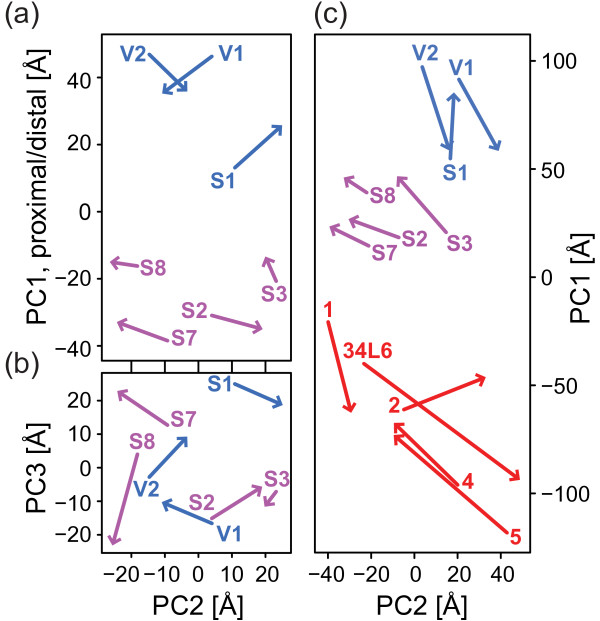
Figure 2.
Superimposition of the subunit centers predicted by the evolutionary model and those of the experimental model from T. thermophilus [[5]]. The arrowheads point towards the coordinates in the evolutionary configuration while the labeled arrow origins correspond to the coordinates in the experimental structure. (a) and (b) show the results for the evolutionary model of the seven conserved matrix arm subunits. The axes are the first three principal components (PC) of the evolutionary configuration. Figure (c) shows the results for the evolutionary model of all 14 conserved membrane and matrix arm subunits. The axes are the first two PCs derived from a PCA on the evolutionary coordinates. Blue: distal matrix arm/N-module; purple: proximal matrix arm/Q-module; red: membrane arm/P-module. Subunit names were abbreviated by omitting the “NDUF” or “NADH” prefixes.

