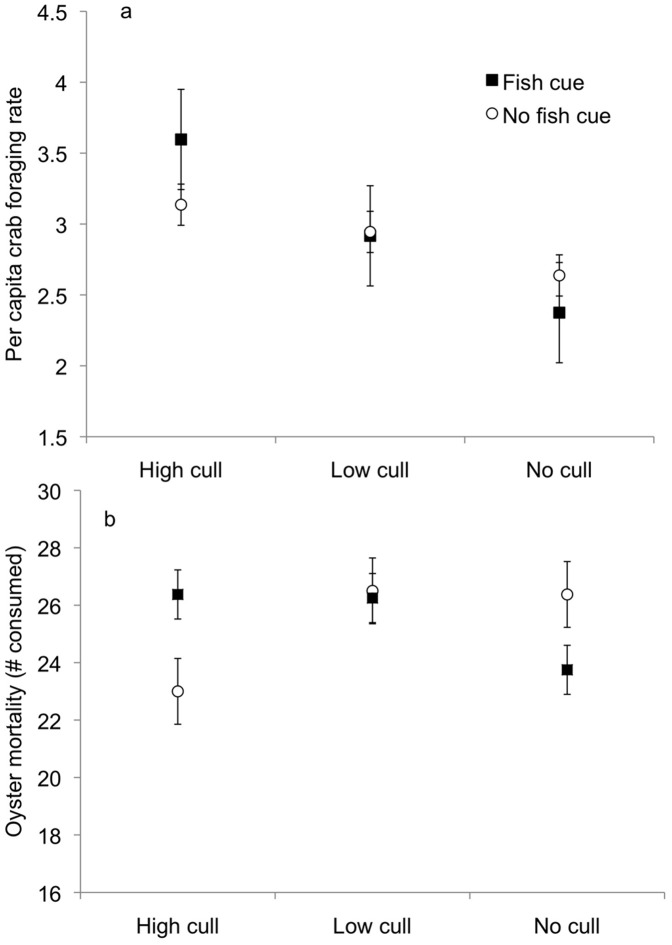
Figure 1. The effects of predator cue and mud crab removal rate on (a) mud crab per capita foraging rate and (b) the number of juvenile oysters consumed during Experiment I.
There was no effect of predator cue on per capita mud crab foraging rates, but we show the predator cue treatments separately for comparison with panel b. Closed squares indicate catfish cue is present at high tide; open circles indicate catfish cue is absent at high tide. Symbols represent means(±SE).

