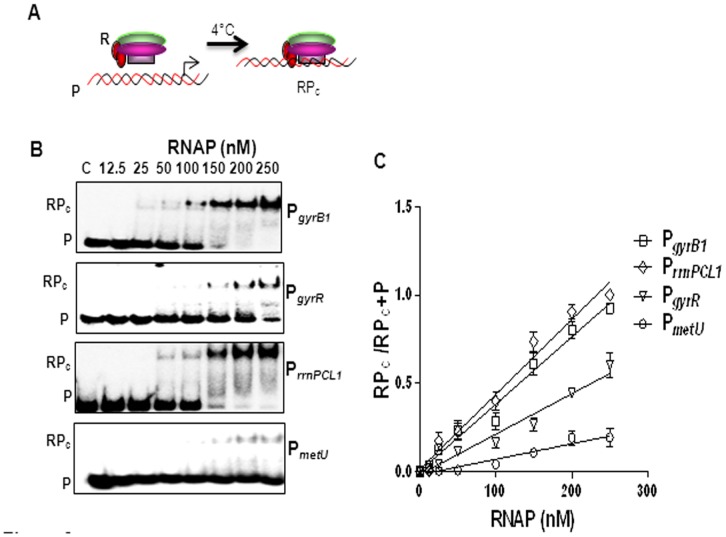
Figure 2. Determination of KB. A.
Scheme of assay, R represents RNAP, P represents promoter fragment and RPc represents closed complex. B Promoter fragments were incubated with different RNAP concentrations for 20 min and the complexes formed were resolved using 4% native-PAGE. C The amount of radioactivity in bound and free fragments was measured by densitometry and indicated as RPc and P respectively. RPc/RPc+P ratios were plotted as function of RNAP concentrations. KB was calculated from the slope of the graph. The values obtained are mean of three independent experiments (Table 1).

