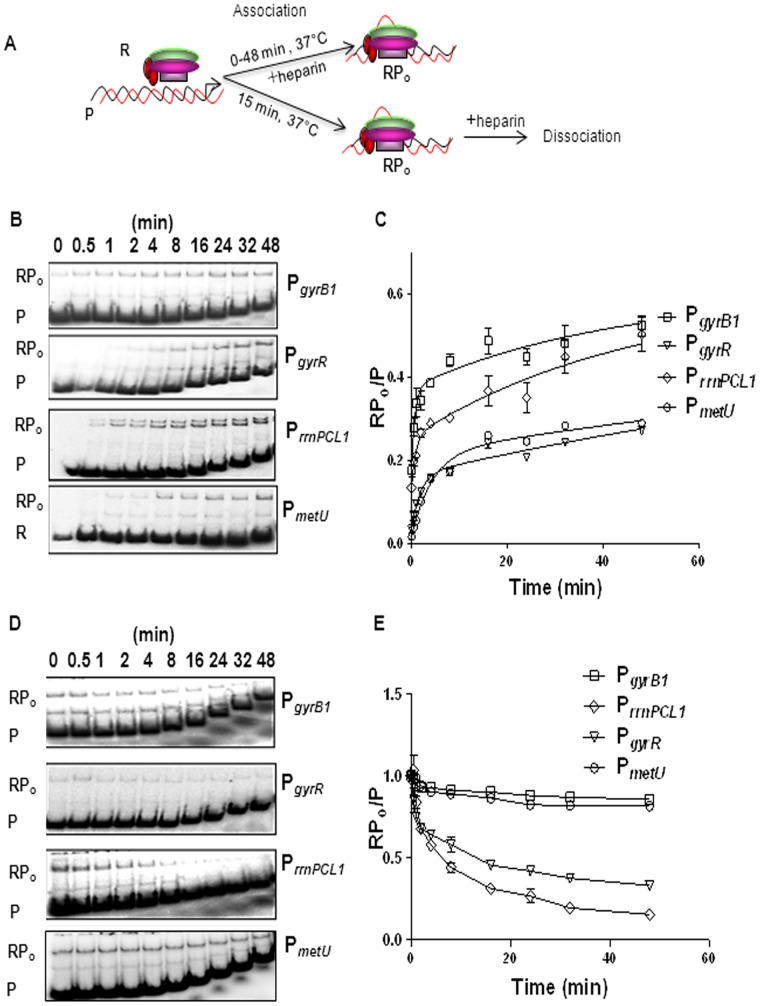
Figure 4. Kinetics of association and dissociation. A.
Scheme of assay, R represents RNAP, P represents promoter fragment and RPo represents open complex. B The association of RNAP and promoter DNA to form open complex was monitored over time intervals ranging from 0 to 48 min, as indicated. C The amount of radioactivity in bound and free fragments was measured by densitometry and indicated as RPo and P respectively. RPo/P ratios were plotted against time and k′ was measured by double exponential association analysis. The values of k′ are mean of three independent experiments and are shown in Table 1. D Open complex at each promoter fragment was formed by incubating RNAP and promoter fragments for 15 min at 37°C. Dissociation of RNAP was monitored by challenging the pre-formed open complex with heparin for time intervals ranging from 0 to 48 min, as indicated. E The data was fit into the double exponential decay equation to measure koff. The biphasic nature of the double exponential decay curve is suggestive of the existence of two complexes decaying at different rates. The steeper and the trailing parts of the curve represent the faster and slower decaying phases respectively. The values of koff are mean of three independent experiments (Table 1).

