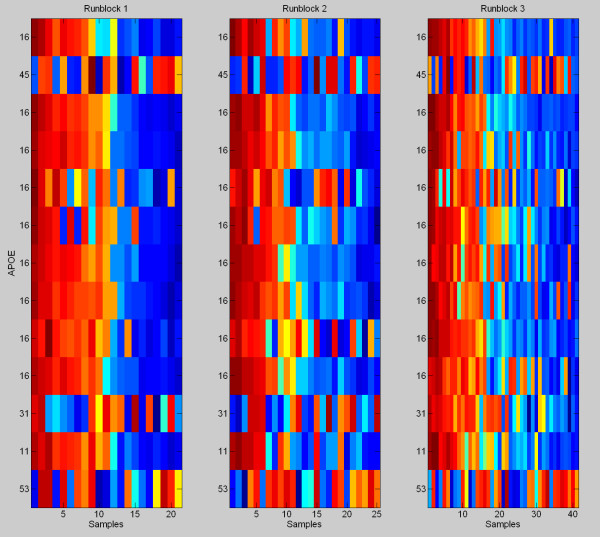
Figure 1.
Peptides from Apo E. A heatmap of all of the isotope groups in the data set that are identified as originating from the protein Apoliprotein E. The numbers on the y-axis indicates which metaprotein that peptide was assigned to. The peptides are ordered from top to bottom from highest to lowest mean intensity across the samples. Note that, while the majority of those peptides share a common expression pattern (those assigned to metaprotein 16), three show a very different, conflicting pattern. Our meta-protein model automatically groups the co-expressing peptides into the same factor while assigning the peptides with conflicting patterns to meta-proteins that more closely match their expression patterns. Each row in each heatmap has been standardized to have mean zero and standard deviation one. Red is a relatively high level of expression and blue a low level of expression.

