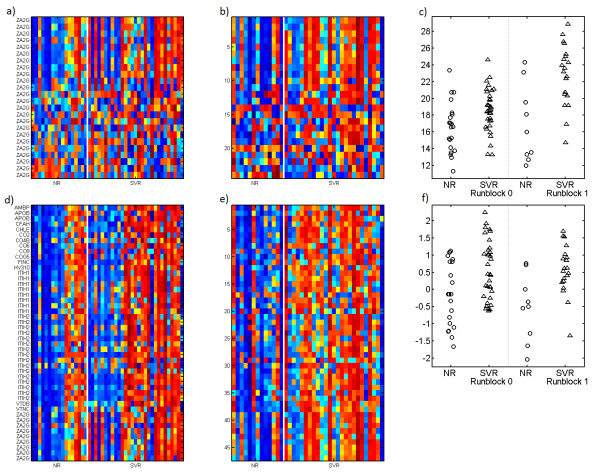
Figure 3 .
Comparison to protein summarization. Comparison of metaprotein and summation approaches to aggregation of large numbers of isotope groups. Panels a (runblock 0) and b (runblock 1) show all of the isotope groups identified as coming from the protein ZA2G. This is one of the two proteins significantly associated with the response to therapy phenotype in patients with Hepatitis C. Samples are on the x-axis and isotope groups are on the y-axis. Samples are labeled NR (non-responder) and SVR (sustained viral response). Panels d and e show the same type of heatmap, but now for the metaprotein containing the largest numbers of isotope groups from ZA2G. Notice that there are a number of isotope groups from other proteins that are highly correlated with the included ZA2G isotope groups and are therefore included in this metaprotein. Also, as can be seen in a and b, correlation of individual isotope groups from the ZA2G protein is high for about half of the isotope groups, but quite poor for many of the others. Panel c shows the predictive performance of the summation algorithm of “protein” level quantitation for ZA2G, split by runblock, and panel f shows the same for the metaprotein. Note that the metaprotein shows better performance and that the performance of the metaprotein is more consistent across the two separate runblocks. Performance of the top 3 algorithm for protein level quantitation is not shown because it is not statistically significantly associated with response to therapy. Each row in each heatmap has been standardized to have mean zero and standard deviation one. Red is a relatively high level of expression and blue a low level of expression.

