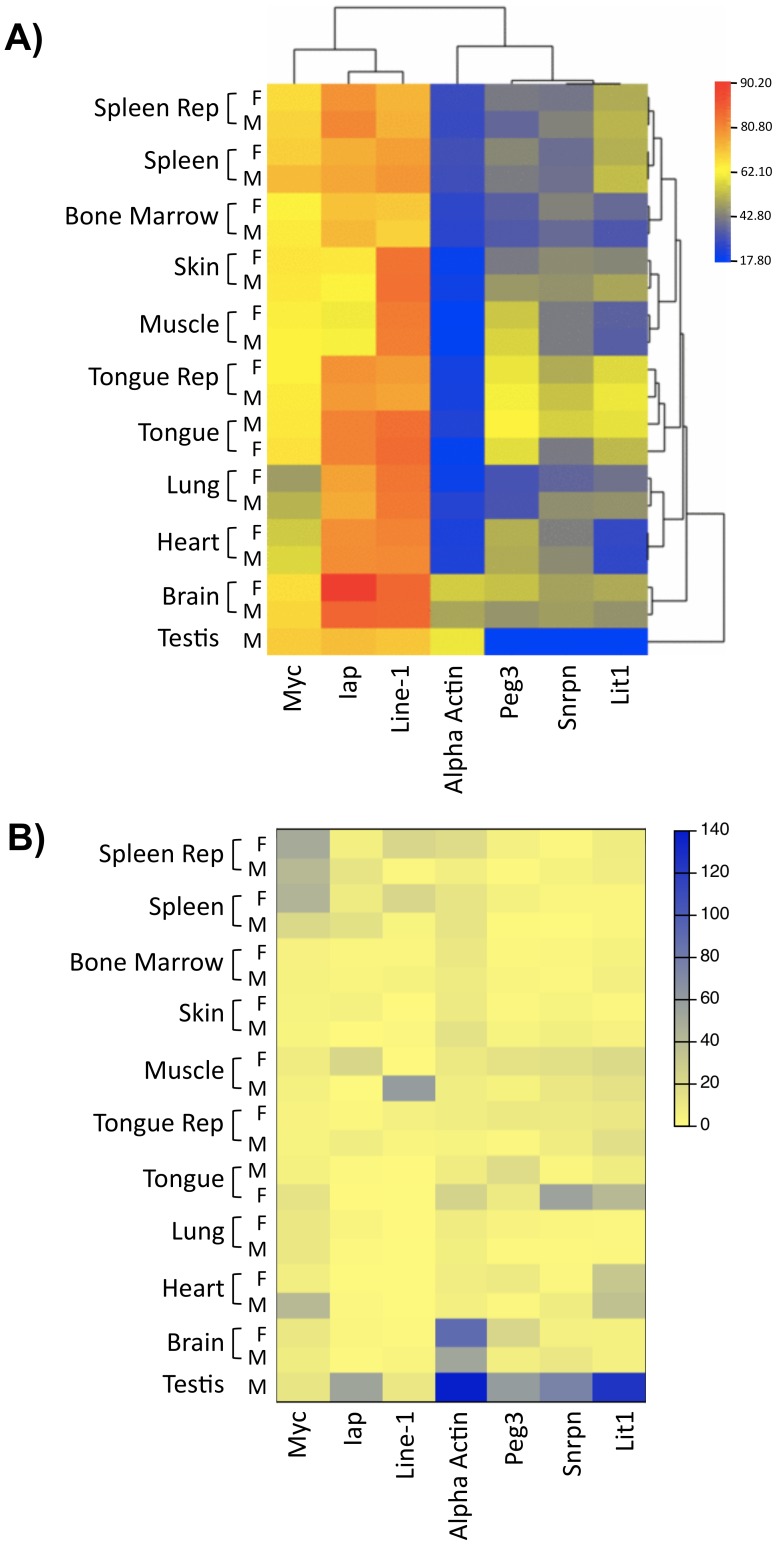
Figure 1. Heat maps of methylation values and variances.
A) Heat map and clustering of average methylation values (based on SIRPH results for the CpG-1 and first population of mice). Using the average linkage and Euclidean distance clustering method the average of all methylation values at a given loci/tissue in males (M) and females (F) (separate) are clustered. B) Heat map of variance of methylation values. The variance at each loci and tissue combination in both male and female mice subpopulations is shown. The levels of variances are noticeably similar in both sexes.

