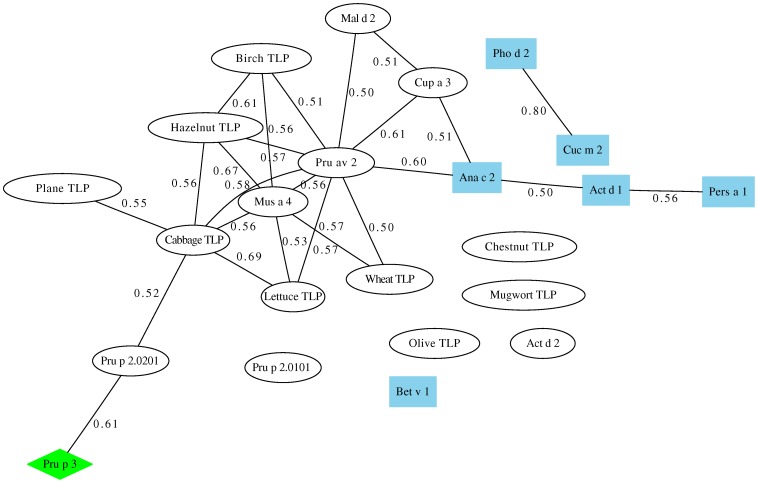
Figure 4. Co-sensitization graph of TLP allergens.
Each node represents one allergen (TLP as white ellipses, non-TLP allergens as blue square nodes, and LTP-allergen Pru p 3 as a green diamond) and the links represent co-sensitization of one or more sera for the linked allergens. The weight of each link, ranging between 0 and 1, measures the degree of co-sensitization. For the sake of clarity, only the 25 links of weight greater than 0.50 out of the total 253 existing links were plotted.

