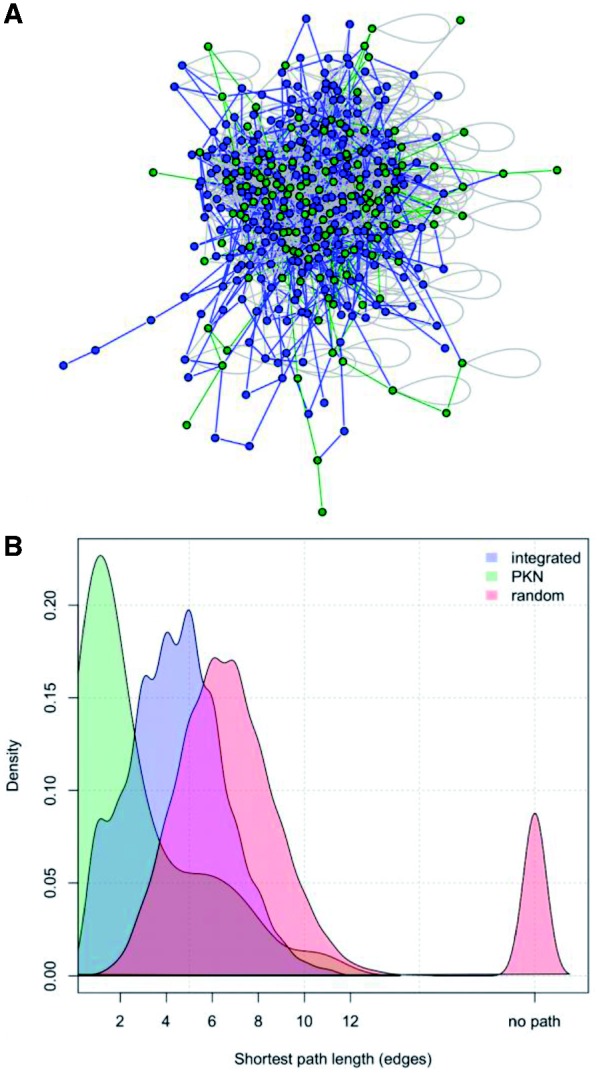
Fig. 5.

Mapping of the PKN to the PIN. (A) Represents the subgraph of the PIN that include only nodes belonging to the PKN (dark grey) and nodes used in the mapping of integrated links (light grey); the network was plotted with R package igraph. The same colour code is used for the edges: as expected, shortest paths between nodes in the PKN (dark grey) are generally shorter than paths used to map integrated links (light grey). This is highlighted also in (B) where the density of the shortest path length (in terms of number of edges) is plotted for integrated links, for links in the PKN and for random links
