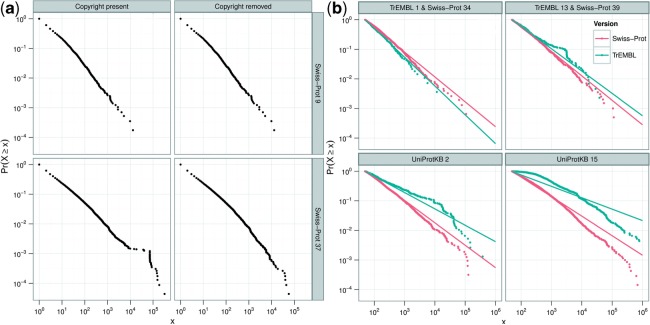
Fig. 2.
Cumulative distributions of words for various Swiss-Prot and TrEMBL versions, shown with logarithmic scales. The size (number of words) is shown along the X-axis whereas the probability is shown on the Y-axis. A point on the graph represents the probability that a word will occur x or more times. For example, the upper left most point represents the probability of 1 (i.e. 100) that a given word will occur once (i.e. 100) or more times. A word must occur at least once to be included. Words occurring very frequently are presented in the bottom right of the graph. (a) Shows the resulting graphs for Swiss-Prot version 9 (November 1988) and Swiss-Prot version 37 (December 1998), with and without copyright. The distinct structure visible between x = 104 and x = 105 in Swiss-Prot version 37 (bottom left panel) is caused by the copyright statement declaration. Swiss-Prot version 9 operates as a control to show that the attempted removal of copyright has no effect where no copyright information is present. (b) Shows the data with fitted power-law distributions for an even subset of historical versions of Swiss-Prot and the co-ordinate release of TrEMBL

