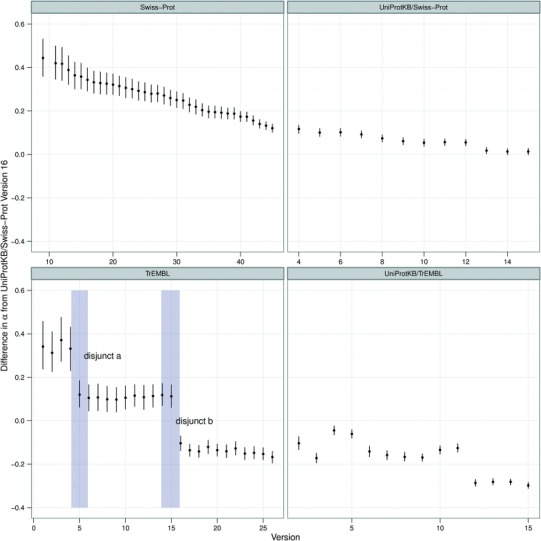
Fig. 3.

α values over time, for each version of Swiss-Prot and TrEMBL. The graph shows the difference in α value (with 95% credible region) from UniProtKB/Swiss-Prot version 16, for which the α value was 1.62. So, for example, Swiss-Prot version 9 has a difference of, approximately, 0.45. Therefore the resulting α for Swiss-Prot version 9 is around 2.07
