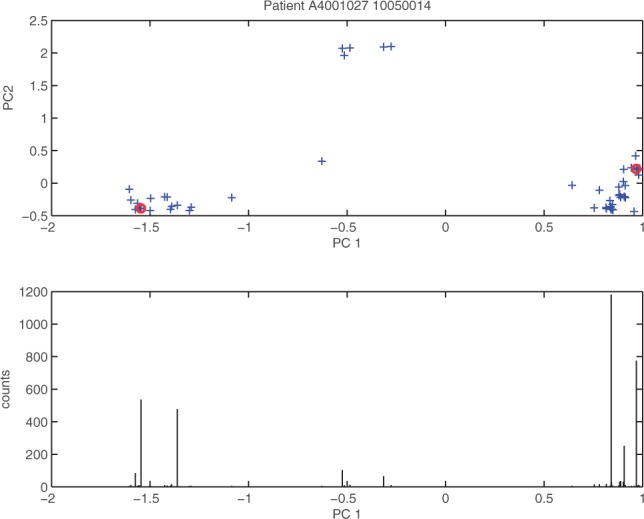
Fig. 1.

Choice of representatives: This plot shows information about the reads of a patient. Each cross in the plot at the top corresponds to a read of the patient and the coordinates are computed by projecting the property encoded reads onto the first and second principal components (PC1 and PC2). The chosen representatives in the PC1 dimension are marked by red circles. The plot at the bottom shows the read counts for the corresponding reads
