Fig. 2.

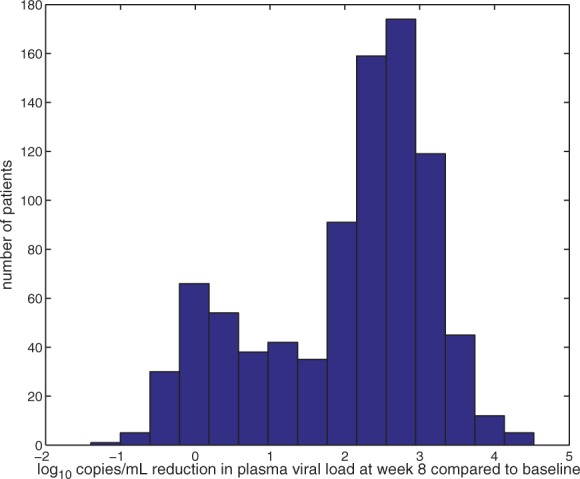
Fold reduction in plasma viral load (PVL): This plot shows the log10 reduction in PVL at week eight compared with baseline levels measured as copies/ml

Fold reduction in plasma viral load (PVL): This plot shows the log10 reduction in PVL at week eight compared with baseline levels measured as copies/ml