Fig. 4.

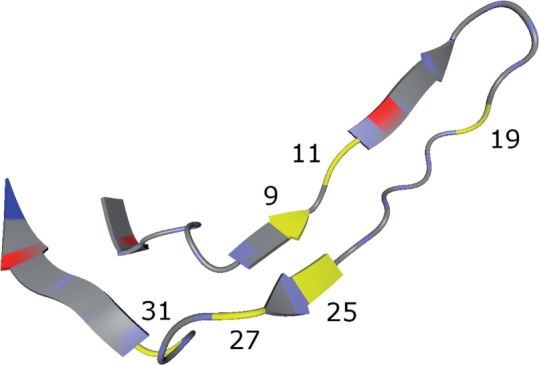
Bound V3 loop with highlighted important positions: This plot shows the V3 loop of the PDB structure 2QAD (Huang et al., 2007), visualized with BALLView (Hildebrandt et al., 2010). The important positions are highlighted in yellow

Bound V3 loop with highlighted important positions: This plot shows the V3 loop of the PDB structure 2QAD (Huang et al., 2007), visualized with BALLView (Hildebrandt et al., 2010). The important positions are highlighted in yellow