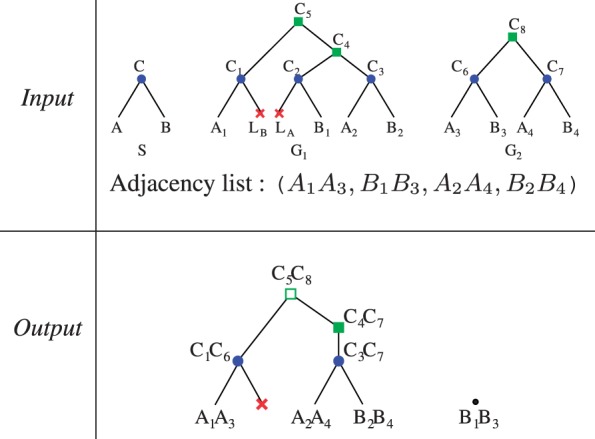
Fig. 2.

Example of the application of the algorithm on two genes trees, G1 and G2, a species tree S and an adjacency list shown on the line Input. The costs are C(Gain)= C(Break)= 1. All the costs cb(Ei,Ej) are computed for b∈0,1, E ∈A,B,C, i,j ∈[1..8], with Ei in G1 and Ej in G2. As a result c0(C5,C8) = 2 while c1(C5,C8) = 1. Therefore, the adjacency forest on the line Output contains C5C8. The left tree has cost 0 while the right one costs C(Gain)= 1 for the gain of the adjacency B1B3
