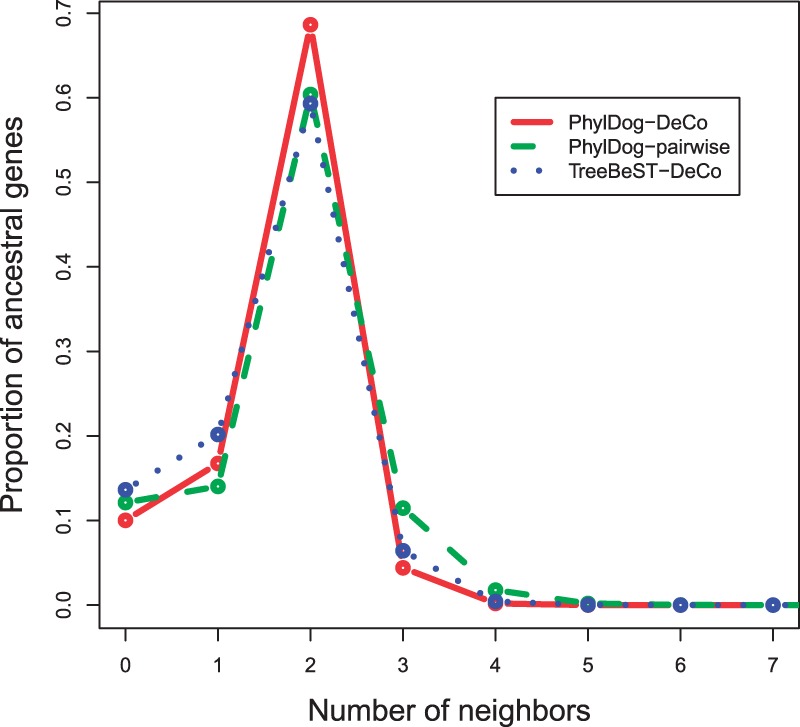
Fig. 3.

Proportion of genes having k neighbors, function of k. Red plain line is obtained with DeCo and PhylDog trees. Green dashed line is obtained with PhylDog trees and the pairwise alternative. Blue dotted line is obtained with TreeBeST trees and DeCo
