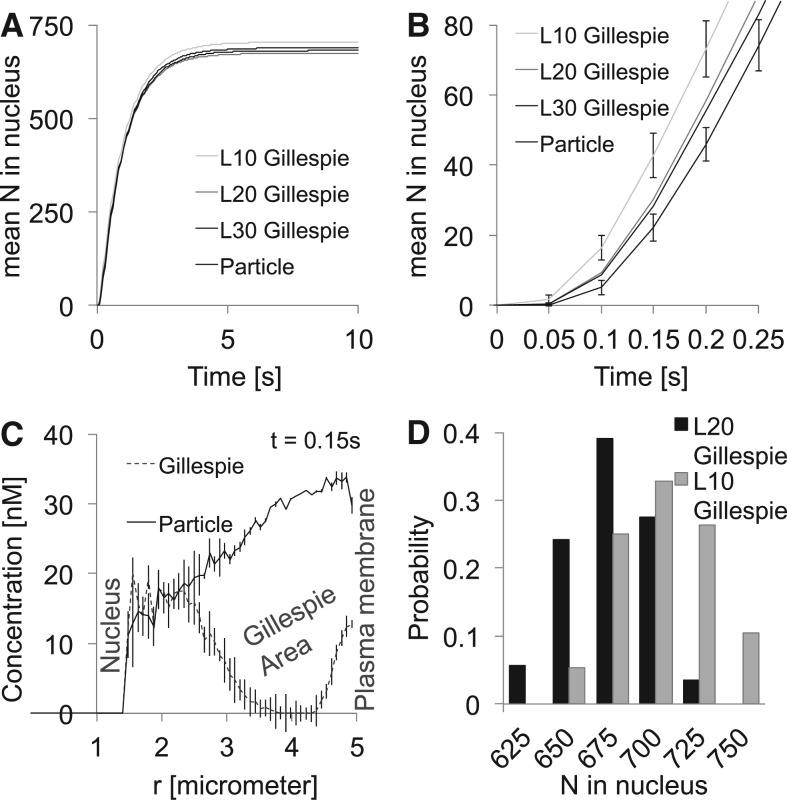
Fig. 3.
(A) Mean of the MAPKpp molecules that reached the nucleus. (B) Initial phase of (A). (C) Spatial distribution of the MAPKpp molecules—counting only the particle molecules (the conversion from cubic areas to the spherical symetric radial distribution hides the sharp cutoff from the particle to the Gillespie area). (D) Distribution of the number of MAPKpp molecules that reached the nucleus within 10s

