
Fig. 6.
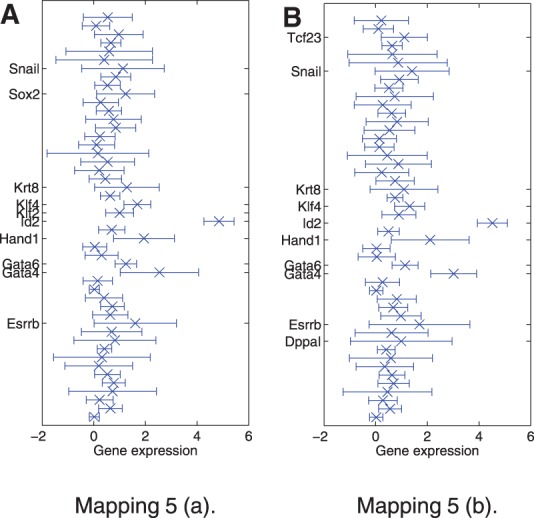
Difference in gene expression between the two subclusters at the 16-cell stage for different mappings. The error bars show the variation of gene expression within the smaller subcluster (1 SD in each direction). For convenience, genes with the strongest differences are labelled in the plots. The order of all genes from top to bottom is Actb, Ahcy, Aqp3, Atp12a, Bmp4, Cdx2, Creb312, Cebpa, Dab2, DppaI, Eomes, Esrrb, Fgf4, Fgfr2, Fn1, Gapdh, Gata3, Gata4, Gata6, Grhl1, Grhl2, Hand1, Hnf4a, Id2, Klf2, Klf4, Klf5, Krt8, Lcp1, Mbnl3, Msc, Msx2, Nanog, Pdgfa, Pdgfra, Pecam1, Pou5f1, Runx1, Sox2, Sall4, Sox17, Snail, Sox13, Tcfap2a, Tcfap2c, Tcf23, Utf1 and Tspan8