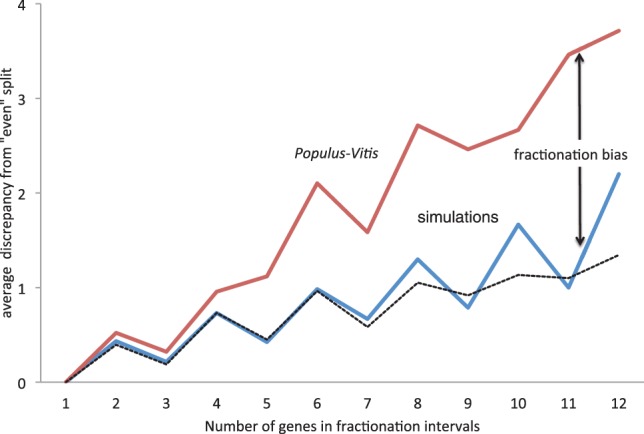
Fig. 10.

Discrepancy in two Populus intervals in the number of genes, compared with random simulations. In Populus regions, the single-copy genes are concentrated in one of the two homeologous intervals. Jagged nature of graphs due not to statistical fluctuation but to measurement of discrepancy from an ‘even’ split, which is necessarily calculated slightly differently for even and odd totals of genes in the fractionation intervals. Black dashed line represents simulations with deletion event run size geometrically distributed with mean 1.7
