Fig. 3.

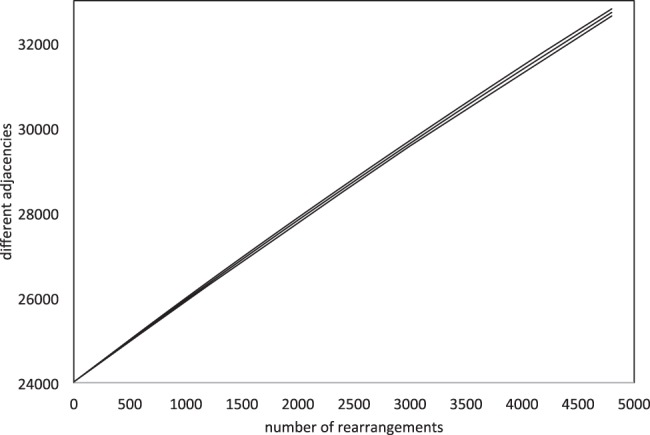
Increase of excess adjacencies in simulations as a function of number of rearrangements r. Vertical axis represents total number of different adjacencies in D and T combined. Showing curves for mean and +/− two SD

Increase of excess adjacencies in simulations as a function of number of rearrangements r. Vertical axis represents total number of different adjacencies in D and T combined. Showing curves for mean and +/− two SD