
Fig. 5.
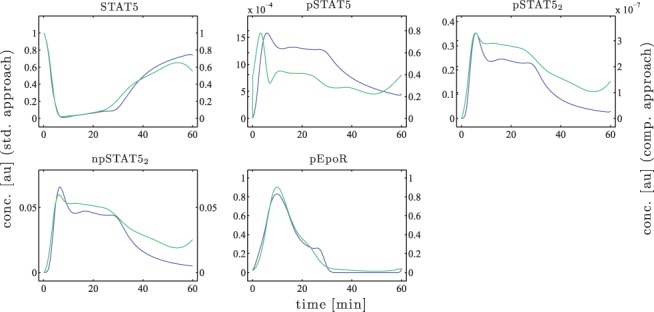
The green solid line represents the trajectory calculated with the standard approach and the blue one with the comprehensive approach. Note the different scaling of the left (standard approach) and the right (comprehensive approach) y-axis for pSTAT5 and pSTAT52