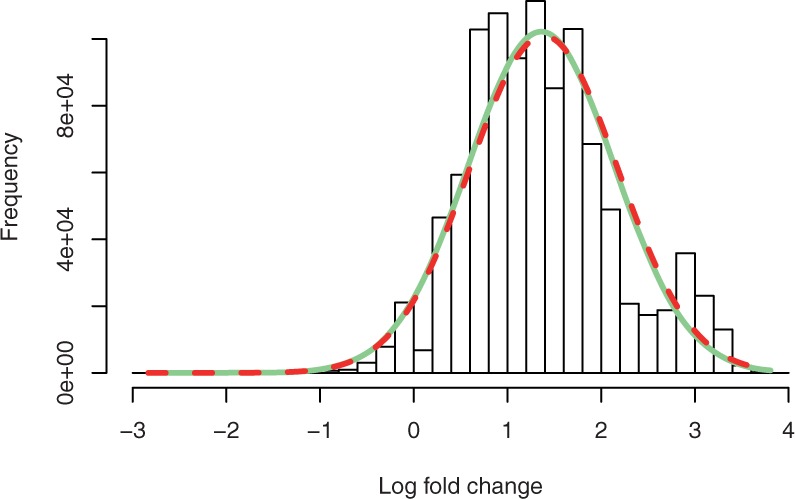
Fig. 1.

Example of an observed x = (2,8,30 000,30 000) with histogram of log fold changes derived from 1 million pairs of Poisson distribution with mean 2 and 8. A correction term of 0.5 was used. The normal approximation using observed fold change and (1/a+1/b+1/c+1/d)-variance (dashed line) follows the normal approximation of the simulated data (solid line). Both do not approximate well the multimodal histogram
