


Fig. 2.
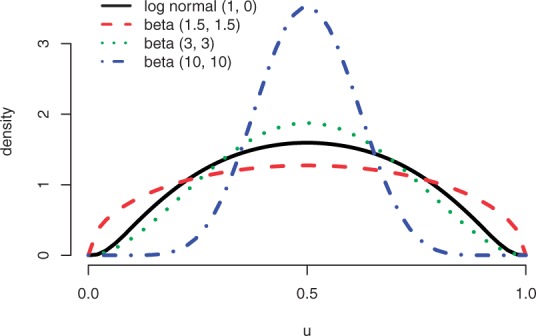
Comparison of the normal and the beta distribution for the random effect ϕ. The solid line represents a normal distribution of logϕ with zero mean and unit variance when transformed to the u-space (see text). The variance of the beta distribution reduces as (α +β) increases. All distribution concentrates around u = 0.5, which is equivalent to ϕ = 1