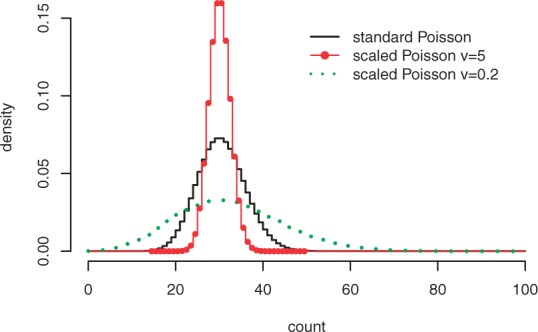
Fig. 3.

Three exponentiated Poisson distributions with modes at 30. The solid line (v = 1) represents the standard Poisson distribution. The distribution with a higher value of v (v = 5) is more tightly distributed around its mode. A lower value of v (v = 0.2) is suited for data exhibiting more variation
